Download
1 / 24
250 likes | 386 Views
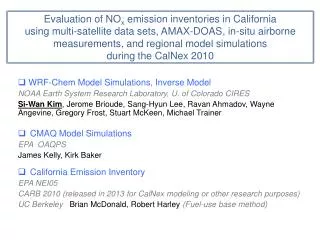
Evaluation of NO x emission inventories in California using multi-satellite data sets, AMAX-DOAS, in-situ airborne measurements, and regional model simulations during the CalNex 2010. WRF- Chem Model Simulations, Inverse Model NOAA Earth System Research Laboratory, U. of Colorado CIRES

E N D
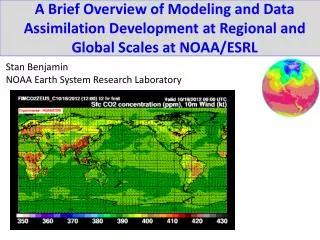
Evaluation of NOx emission inventories in California using multi-satellite data sets, AMAX-DOAS, in-situ airborne measurements, and regional model simulations during the CalNex 2010 WRF-ChemModel Simulations, Inverse Model NOAA Earth System Research Laboratory, U. of Colorado CIRES Si-Wan Kim, Jerome Brioude, Sang-Hyun Lee, RavanAhmadov, Wayne Angevine, Gregory Frost, Stuart McKeen, Michael Trainer CMAQ Model Simulations EPA OAQPS James Kelly, Kirk Baker California Emission Inventory EPA NEI05 CARB 2010 (released in 2013 for CalNex modeling or other research purposes) UC Berkeley Brian McDonald, Robert Harley (Fuel-use base method)
NOAA WP-3D NO2 • NOAA Earth System Research Laboratory, U. of Colorado CIRES • Ilana Pollack, Thomas Ryerson • CU-AMAX-DOAS NO2 • U. of Colorado • HilkeOetjen*, Sunil Baidar, Rainer Volkamer • *Now at Jet Propulsion Laboratory Satellite NO2 columns Dalhousie U. Randall Martin KNMIK. FolkardBoersma NASALokLamsal, Eric Bucsela, Edward Celarier, NickolayKrotkov UC Berkeley Ashley Russell, Lukas Valin, Ronald Cohen U. Bremen Andreas Richter, John Burrows BEHR
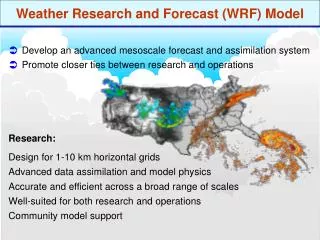
Background - CalNex 2010 - Trend in NOx emission Motivation and goal 3. Results - Emission inventories - Comparisons of model and observations In-situ aircraft obs. AMAX-DOAS obs. Satellite obs. (WRF-Chem and CMAQ) All days, Weekday and Weekend 4. Summary and conclusions Outline
NOAA WP-3D (May-June 2010) NOAA Twin-Otter (May-July 2010) California case: CalNex 2010(California Research at the Nexus of Air Quality and Climate Change)http://www.esrl.noaa.gov/csd/calnex CU-AMAX-DOAS NO2 columns In-Situ NO2 Los Angeles
SCIAMACHY (University of Bremen) May-September 2003 2003 Pasadena Ontario Satellite tropospheric NO2 columns and trend: the LA basin LAX 2010 2010 Pasadena Ontario LAX
OMI (University of Bremen) May-September 2005 surface monitor Pasadena Satellite tropospheric NO2 columns and trend: the LA basin Ontario LAX OMI • Temporal change • ~30% reduction of ambient NO2 • between 2005 and 2010 • Mobile emission control and • recession • (McDonald et al., JGR, 2012) • Model(NEI05)/Obs. ≈ 1.4 2010 Pasadena Ontario LAX
WRF-Chem model version 3.4.1 Domains: Western US & CA Number of vertical levels: 60 Simulation period: Apr/26-Jul/17 2010 Meteorological I.C. and B.C.: NCEP GFS Idealized Chemical I.C. and B.C. for U.S. 12km resolution domain (D1): clean maritime condition Anthropogenic emissions: EPA NEI-2005 , Inverse models, and CARB10 Biogenic emissions: BEIS3.13+Urban isoprene Chemical mechanisms: RACM (Stockwell et al., 1997) ~30 reactions updated following JPL 2006 report Cumulus parameterization for D1 only Lin microphysics scheme YSU Planetary Boundary Layer model Noah Land surface model WRF-Chem Model Domains D1: Western US (12 x 12 km2 resolution) D2: California (4 x 4 km2 resolution) - Satellite, Aircraft observations and Model comparison Using model for evaluation of NOX emission inventory D1 12 x 12 km2 D1 D2 4 x 4 km2 D2
Satellite v. Model (projected to pixels): 6/1/2010 over the LA basin NASA OMI NO2 KNMI OMI NO2 OMI albedo GMI NO2 OMI albedo TM4 NO2 BEHR OMI NO2 WRF-Chem NEI05 MODIS albedo WRF-Chem NO2 • Excellent spatial coverage of satellite data • Large difference among the retrievals • Model (NEI05) >> OMI columns Satellite problem? or Emission problem?
Consistent large biases issues in emission inventory Emission year 2005 CalNex (simulation period) 2010 In-situ Aircraft Obs. WRF(Model)/Obs. > 1.4 LA CU-AMAX-DOAS Satellite (OMI) LA LA
Motivation and Goal • California emission inventories need to include recent reductions in NOXemissions (e.g., McDonald et al., 2012) and reduce uncertainties in emission factors/activities • Evaluate up-to-date California NOX and VOC emission inventories • with model simulations and observations during CalNex 2010 and • find solutions for better emission inventories. • * NOAA-P3 in-situ NO2 aircraft observation • 5/4, 5/14, 5/19,5/8, 5/16, 6/20 • * NOAA Twin Otter CU-AMAX-DOAS NO2 column • 6/1, 6/4, 6/7, 6/24, 7/12, 7/16,6/5, 6/26, 7/5, 7/17 • * Multiple satellite tropospheric NO2 columns • 5/7, 5/14, 6/1, 6/3, 6/17, 6/24, 7/12,5/16, 6/26, 7/3, 7/5 Weekday Weekend
Emission inventories • NEI05 • EPA NEI 2005 (MOBILE6, NONROAD) • JB_NOx (NOx inverse model results + NEI05_VOC) • Inverse model results using aircraft obs. during CalNex 2010 • (Jerome Brioude et al., ACP, 2013) • AB_VOC(NOx inverse model results + Borbon VOC) • The same as JB_NOx except for VOC updates based on • Agnes Borbon et al. (JGR, 2012) observations at the CalTech site • CARB10 • Released in 2013 for research purpose (e.g., CalNex modeling)
NOAA-P3 (in-situ) v. Model using different EIs: LA Altitude above ground level < 1km Inverse model emissions and CARB10 are much improved compared to NEI05 Inverse model results (JB_NOx and AB_VOC) have the best correlation with obs.
Diurnal variations of NOx emissions Offroad+Area source • Offroad + Stationary Area Sources in the NEI2005 may explain large discrepancies between the model and the obs during CalNex 2010. • large nighttime emissions • Improved in NEI2008 and NEI2011?
NEI-2005 NOx partition in Los Angeles NEI05_Gas > CARB10*_Gas (70% higher) NEI05_Diesel ≈ CARB10*_Diesel NEI05_Onroad is 33% higher than CARB10*_Onroad. *CARB10 CEPAM: 2009 Almanac-Standard Emission Tool http://www.arb.ca.gov/app/emsinv/fcemssumcat2009.php Potentially large uncertainties in: NonRoad Construction & Lawn Mowing 2. Area source (based on year 2002) Commercial Marine Vessels (CMVs) Kim et al., 2011, ACP 3. Point source (based on year 2002) LA NOx Area Source 75% reduction in Nonroad 40% reduction in Area to be consistent with McDonald et al. (2012)
NOAA Twin Otter CU-AMAX-DOAS column NO2 v. Model using different EIs over LA Model > AMAX-DOAS obs. Inverse model emissions and CARB10 are improved compared to NEI05 CARB10 has the best correlation with obs. *Morning observations (influence of nighttime emission and previous day’s condition) *Warm July episodes (sensitive to local circulation: seabreeze onset, nighttime drainage)
OMI tropospheric NO2 columns v. Model using different EIs over LA Average of 3 OMI retrievals • Correlation between the model and OMI columns is high (0.8-0.9). • OMI retrievals are variable (UCB/NASA=1.6). • CARB10and inverse model results are improved compared to NEI05. • NASA retrieval is being recalculated with the WRF-Chem 4km x 4km NO2 profile.
Weekday v. Weekend over LA: NOAA P3 (in-situ data) Ratio of Weekendto Weekday Observation (NOAA P3) = 0.37 (63% reduction) WRF-Chem NO2 NEI05 = 0.51 (NOx emission ratio = 0.71) JB_NOx = 0.37(emission ratio = 0.62) AB_VOC = 0.37 CARB10 = 0.49 (emission ratio= 0.76)
CA urban and agricultural areas OMI agrees better with CARB10 across CA urban areas. Model columns over central valley are lower than the obs.
Satellite v. CMAQ: 6/1/2010 over the LA basin NASA OMI NO2 KNMI OMI NO2 OMI albedo GMI NO2 OMI albedo TM4 NO2 BEHR OMI NO2 CMAQ MODIS albedo WRF-ChemNO2 NEI05 CMAQ columns were projected to OMI pixels.
NOx emission used for CMAQ simulations Purple line: CMAQ NOx emission in CMAQ is much reduced compared to NEI05. But it is slighter larger than CARB10 and inversion. NOX emission in CMAQ: On-road emission was interpolated from CARB07 and CARB11. Spatial distribution using SMOKE-MOVE CEMS 2010 for point source
Los Angeles No substantial biases between two model simulations Preliminary results! CMAQ v. WRF-ChemNO2 columns
Average bias = 65% Average bias = 24% Los Angeles CMAQ v. OMI (NASA, KNMI, BEHR) Average bias = 3% CMAQ NO2 columns agree better with KNMI and BEHR columns in terms of biases Preliminary results!
NEI05 CARB10 Impact of A Priori NO2 profiles on NASA OMI retrieval Los Angeles Inversion Satellite NO2 columns increased when WRF-Chem NO2 profiles were used as a priori profile for retrieval.
Summary and Conclusions • Uncertainties in California NOX emission inventories • - NOx (and CO) in CARB10 is improved compared to NEI05 (correlation , bias ). • - Inversion results are promising (correlation , bias ). • Large uncertainties in area and offroadsource in EPA NEI • NOx emission biases in the NEI05 were identified with satellite retrievals of tropospheric NO2 as well as AMAX-DOAS and in-situ aircraft observations. • Biases of CMAQ NO2 columns relative to different retrievals were consistent with • those of WRF-Chem columns. • To understand variability among the satellite retrievals, impact of a priori profile on NASA standard retrieval was examined. • Using WRF-Chem NO2 profile as a priori for retrieval increase satellite columns. • Emission inventory also affects the satellite retrieval.