Download
1 / 20
200 likes | 287 Views
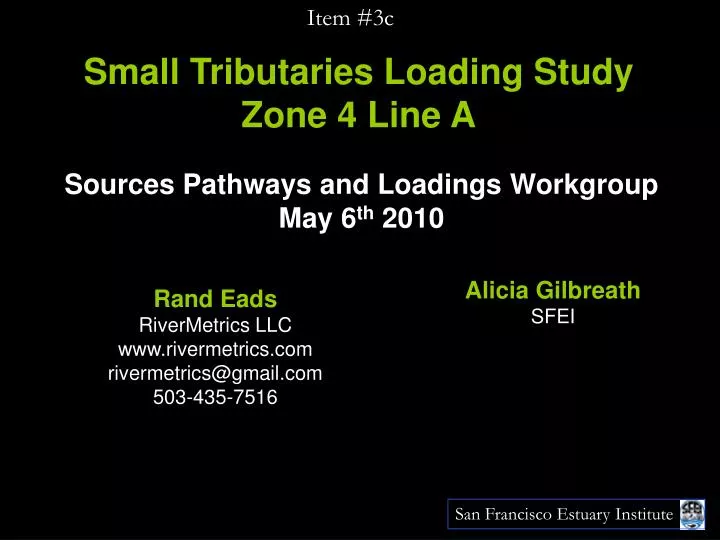
Item #3c. San Francisco Estuary Institute. Small Tributaries Loading Study Zone 4 Line A. Sources Pathways and Loadings Workgroup May 6 th 2010. Alicia Gilbreath SFEI. Rand Eads RiverMetrics LLC www.rivermetrics.com rivermetrics@gmail.com 503-435-7516. Item #3c.

E N D
Item #3c San Francisco Estuary Institute Small Tributaries Loading Study Zone 4 Line A Sources Pathways and Loadings Workgroup May 6th 2010 Alicia Gilbreath SFEI Rand Eads RiverMetrics LLC www.rivermetrics.com rivermetrics@gmail.com 503-435-7516
Item #3c San Francisco Estuary Institute
San Francisco Estuary Institute Item #3c Years sampled so far
San Francisco Estuary Institute Item #3c Flow-Sediment Summary
San Francisco Estuary Institute Item #3c
San Francisco Estuary Institute Item #3c
San Francisco Estuary Institute Item #3c Flow -Turbidity - SedimentCharacteristics • Rapid response to rainfall • Duration of hydrograph is short • Poor relation between flow and sediment • Phase and amplitude of flow and turbidity peaks often different • Turbidity-SSC relation is good to excellent • Storm-wise SSC loads slight improvement over annual loads • Storms with multiple flow peaks often have declining turbidity peaks
Sample Inventory Item #3c San Francisco Estuary Institute
San Francisco Estuary Institute Item #3c • HgT range (n=76*): 1.4 – 113 ng/L • * only samples during times the turbidity was recorded are reported.
San Francisco Estuary Institute Item #3c • t-PCB range (n=43*): 332 – 52,375 pg/L • * only samples during times turbidity was recorded are reported.
San Francisco Estuary Institute Item #3c Rainfall data downloaded from Western Regional Climate Center (www.wrcc.dri.edu)
San Francisco Estuary Institute Loads Item #3c Long-term Avg 2007 Long-term Avg Long-term Avg 2009 2007 2007 2009 2009 HgT (g) t-PCBs (g) Cu (kg)
San Francisco Estuary Institute Item #3c
San Francisco Estuary Institute Item #3c
Side-by-side Automated Hg Sampling San Francisco Estuary Institute Item #3c RPD = 54% 11.6% 0.8% 3.8% 3.3%
Automated PCB Sampling San Francisco Estuary Institute Item #3c RPD = 54% 11.6% 0.8% 3.8% 3.3%
Item #3c What We Don’t Know • Upper end of discharge rating only 1 measurement above 135 cfs • Low flow discharge & turbidity spikes unrelated to rainfall • Contaminant-turbidity relationship at higher turbidity • Not sampled a wet year with high intensity rainfall
Item #3c Acknowledgements Labs: MLML Axys Analytical Brooks Rand Romberg-Tiburon Center for Environmental Studies Site Access and Rainfall Data: Alameda County Flood Control and Water Conservation District
San Francisco Estuary Institute Loads: Area-normalized Item #3c
San Francisco Estuary Institute FWMC Item #3c