Future Climate Projections: CO₂ Forcing, Sensitivity, and Feedback Mechanisms
Explore the intricacies of future climate scenarios, focusing on CO₂ forcing, climate sensitivity, and feedback loops. This research highlights the potential for global warming impacts due to various natural and anthropogenic forces. Sessions will cover key findings from recent papers and posters, including emission predictions, stabilization scenarios, and the role of feedback mechanisms like ice-albedo and water vapor. Join us for poster sessions on March 12 and 13, and participate in discussions on the implications for the biosphere and ocean sinks.

Future Climate Projections: CO₂ Forcing, Sensitivity, and Feedback Mechanisms
E N D
Presentation Transcript
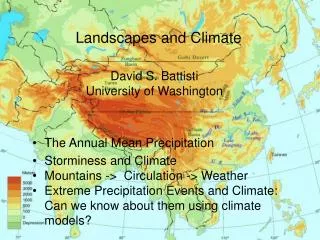
This Week: Future Climate Future CO2 Forcing Climate Sensitivity – Feedbacks Natural Short and Long-term Forcings Global Warming Impacts
Announcements • See handout and website for details regarding paper and poster content • Poster Sessions: March 12 and 13 in Mary Gates Commons 10:30 – 11:20 • Monday March 17 8:30 AM, Final Exam, JHN 075 (here) • Papers and descriptions of 3 other posters due Wednesday March 19
Kaya Identity Model kaya identity model
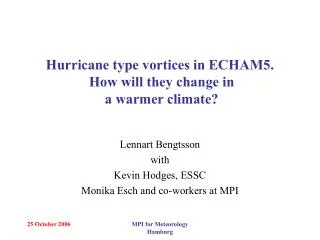
Future Atmospheric CO2 One emission scenario Range of predictions suggest double pre-industrial by mid-century
Stabilization Scenarios 2100 2200 2300 2000 What our emissions can be for different constant CO2 levels. What do these tell us about future biosphere and ocean sinks?
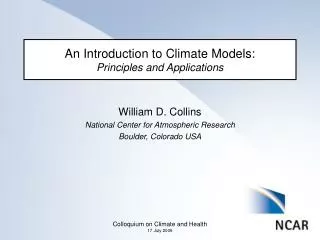
Climate Sensitivity-All about Feedbacks T = F • is climate sensitivity parameter units: K “per” W/m2 determined by feedbacks!
Estimates of Climate Sensitivity T change for a 4 W/m2 forcing (i.e. “double CO2”) Most probable ~ 0.75 K/(W/m2)
Announcements • Get a handout on paper/poster guidelines • Brian’s office hours today canceled, moved to Thursday 5-6pm • My office hours are today, 3:30 – 4:30pm in 506 ATG
Feedbacks “feedback loop” +/- +/- State Variable Process or coupling Initial Forcing + increases state variable - decreases state variable
Ice-Albedo Feedback Albedo - Example of a positive feedback More solar radiation absorbed + Temperature + Initial Forcing (e.g. GHG) Ice melts, dark soils exposed
Water Vapor-Temperature Feedback Water Vapor + Increased Greenhouse effect + Temperature + Initial Forcing (e.g. GHG, solar radiation) More evaporation, saturation vapor pressure increase
Atmosphere—Protector of the Oceans? water trap If H2O reaches top of atmosphere it is blown apart by UV radiation H atoms escape to space, never to return Probable cause for no H2O on Venus
IR Flux-Temperature Feedback Outgoing IR flux increases + Example of a negative feedback - Temperature + Initial Forcing (e.g. GHG)
Phytoplankton-DMS-Marine Cloud Feedback Charlson, Lovelock, Andreae, Warren “C.L.A.W.” Hypothesis aerosols and cloudiness + - Solar Radiation (Temperature) Biogenic Sulfur Emissions + Initial Forcing (decreased clouds) + + Photosynthesis
Cloud Forcings and Feedbacks Low altitude thick clouds Stratus High altitude thin ice clouds Cirrus
Aircraft emit particles (and particle precursors) which can nucleat clouds. This activity gives rise to a • Positive radiative forcing • Negative radiative forcing
Aviation Contrails—Positive Forcing October 2004
Clouds and Climate—a complex problem Cirrus: Not so reflective, but absorb and emit at cold T Low Clouds: Absorb IR but emit like warm surface. Reflective
Clouds and Cloud Feedbacks Albedo + - Low Clouds + + Atmosphere holds more water Increased greenhouse effect + + High Clouds + Atmosphere holds more water Uncertain! Temperature Initial Forcing (e.g. GHG, solar radiation) Temperature
Predicted Changes in Cloud Forcings IPCC 2007
The solar cycle forcing has increased from -0.1 to 0.2 W/m2 since 1900. This forcing can explain ____ of 1oC increase in global Avg. T since 1900 • 60 - 70% • 40 - 50% • 20 - 30%
False Assertions: Sun – Global Warming WRONG Solar Cycle WRONG T record Originally from WSJ Article written by two chemists named Robinson
False Assertions: Sun – Global Warming Correct cycle Laut 2003
Neutral Walker Circulation Neutral
El Nino/La Nina Circulation Patterns Very Strong El Nino Strong La Nina
ENSO “Periodicity” El Niño years La Niña years
El Nino Impact on Fish Normal El Nino
Pleistocene Glacial and Interglacials Reconstruction of land and sea ice 21,000 years ago (last glacial maximum) February July
Records of NH Glaciations Geological Records: glacial deposits, scarring, larger scale Cordilleran Ice Sheet Lake Missoula Spokane Floods (from Lake Missoula)
Milankovitch—Before sediment cores Predicts glacial and interglacial transitions based on variations in Earth’s orbit His results suggested many such transitions in ~ 1 million yrs (he was right) —at the time, no observable records show that many, so his work widely criticized Milutin Milankovitch
Milankovitch Continued While lacking patience for critics, he did not lack confidence Milutin Milankovitch “I do not consider it my duty to give an elementary education to the ignorant, and I have also never tried to force others to use my theory, with which no one could find fault.”
Orbital Forcing Summary Precession Tilt Eccentricity IPCC 2007
Orbital Forcing Summary Cartoon • orbital forcings
Currently NH summer takes place at aphelion, in about 12,000 years, NH summer will occur at perihelion. At this time, SH seasonality will be • stronger • weaker
Recent UW Research Time rate of change of ice volume and solar insolation
The Key For Glaciation + Ice Coverage Solar insolation in NH summer appears to be key maintaining glaciation. Ice sensitive to melting! Positive Feedback—Destabilizing Climate - T Albedo - Initial Forcing Weaker NH summer insolation + Same old ice-albedo feedback, just different initial forcing
Questions—In Class Activity • Given the behavior of CO2 and CH4 is there a positive or negative feedback with T? • Provide a feedback involving marine biota which might explain CO2’s behavior. • Suppose marine biota are the cause of CO2’s behavior, is this support for or against Gaia theory? • When’s the next glacial maximum? Do you think we’ll get there?