Download

1 / 9
90 likes | 192 Views
Learn how to save a graph displayed on your screen effectively. Start by maximizing the graph's window for clarity. Click on the “Format this page for printing” icon if you want confidence intervals to appear, then hit the Print Screen key to copy the visible graph. Use Paint to paste and outline the graph you’ve copied for a clean image. You can resize it if needed, but be cautious as resizing can make the image blurry. Follow these steps to easily insert the saved image into PowerPoint, Word, or any other application.

E N D
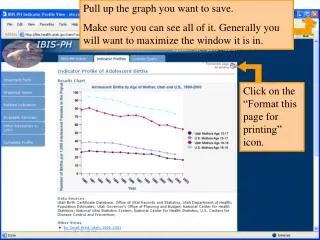
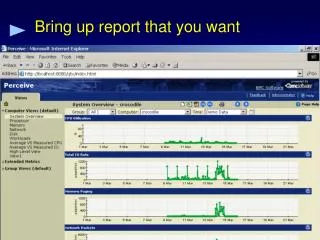
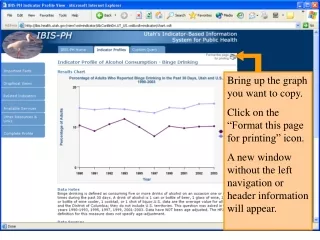
Pull up the graph you want to save. Make sure you can see all of it. Generally you will want to maximize the window it is in. Click on the “Format this page for printing” icon.
When you format for printing the confidence intervals are visible (see the pink line, Utah Mothers Age 18-19). If you do not want the confidence intervals then skip the format for printing step.
When you have the graph on your screen hit the Print Screen button. Usually it is on the top row of keys near the number pad. By hitting the Print Screen button you save a copy of whatever is currently on your screen. You can also use the Alt + Print Screen button to save only the active window.
Open Paint (Start, All Programs, Accessories, Paint). Choose Edit and Paste or hold down control + v to paste the image into Paint.
Use the selection tool. Outline the graph. It will be outlined with a dotted line. Choose Edit, Copy or Ctrl + c.
Select Edit, Paste. The graph you outlined and copied will appear. To save the file, select File, Save.
Note: You can resize the file here, but changing its size will make it fuzzy/blurry. To change the size select Image, Stretch/Skew. Make sure you use the same percentage for vertical and horizontal to maintain the aspect ratio.
Insert the file into PowerPoint, Word or wherever you need it.