Download
1 / 12
120 likes | 243 Views
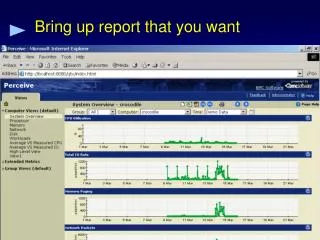
Bring up report that you want. Right click on report frame and chose ‘properties’. Copy the url address to get the string for creating the report. Add &r=pdf in you shell script. Report is automagically produced in PDF. Embedded Perceive.

E N D
Copy the url address to get the string for creating the report
Embedded Perceive • Problem: Customer has existing internal website which has been highly developed. Provides Security and directed views. Perceive has data and the look but not the heart. • Solution: Combine the two sites. • - Or wait until the ESM Common reporting portal…
Embedding URL’s • All created views have an associated number • - See reports.xml • Right-click on any view and create shortcut on desktop • http://localhost:8080/qtv/report2.jsp?report-id=6&ver=1&node-id=twhite2&sd=1082696400000&ed=1083024000000&domain-id=3&theme-id=pwc&width=815&height=509&isSaveAs=null • Modified=C0C1104A042CC401D0
Embedding URL’s • Important fields • http://localhost:8080/qtv/report2.jsp? • report-id=6& • ver=1& • node-id=twhite2& • sd=1082696400000& • ed=1083024000000& • width=815&height=509& • isSaveAs=null
Embedding URL’s • Important fields • http://localhost:8080/qtv/report2.jsp? • report-id=6& Maps to reports.xml • ver=1& • node-id=twhite2& • sd=1082696400000& milliseconds since • ed=1083024000000& EPOCH • width=815&height=509& • isSaveAs=null
EPOCH time • Limitation with the embedding method is time is fixed! • sd=1082696400000& milliseconds since • ed=1083024000000& EPOCH • 1083024000000 – 1082696400000 = 327600000 • 327600000 ms = 327600 sec • = 5460 min • = 91 hrs • EPOCH was 01/01/1970 12:00am
Embed just the graphics • Use ‘chartimg’ • http://localhost:8080/qtv/chartimg.jsp?chart-id=86&sd=1068121260000&ed=1068124860000&report-id=21&width=325&height=97&node-id=s400i.bmc.com&theme-id=pwc • To get quick links, in Perceive browse to the graphic you want to embed and in IE right-click-->Properties and copy the "Address" field into the address of your browser. Then play with the width/height, say, to change it.
Other options • Html output infers interaction with non-existent top frame. (Not good) • Use r=pdf to output pdf • Others are xml, csv, excel