Download
1 / 9
100 likes | 493 Views
Financial Analysis for Electronic Arts, Inc. and Main Competitors. Presented by: Everette Benjamin David Krasnowiecki Jacob Marco Scott Traver Steve Senft Tao Wang. Introduction. Electronic Arts, Inc. In 2009, Net Income was -$1,088 million

E N D
Financial Analysis for Electronic Arts, Inc. and Main Competitors Presented by: Everette Benjamin David Krasnowiecki Jacob Marco Scott Traver Steve Senft Tao Wang
Introduction Electronic Arts, Inc. • In 2009, Net Income was -$1,088 million • Revenue has increased over past three years • No long term investments for the past three years • No long term debt past three years
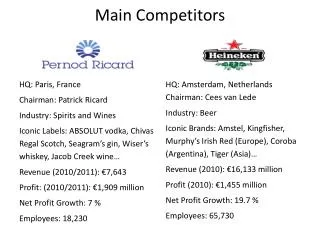
Competitors: • Activision, Inc. • World’s first independent developer and distributor of video games • Top video game publisher in 2007 • Take-Two Interactive Software • Own 2K Games & Rockstar Games • Electronic Arts proposed acquisition in 2008 The Firm: • Electronic Arts, Inc • Interactive software company • One of the world’s largest third-party publishers • Most successful products are sports games • Madden NFL • NBA Live • The Sims • Need For Speed
Market Value Ratios for EA • Strengths • Price/Free cash flow is 8x higher than industry average • Future of companies health is stable • Weakness • Big declining in market cap, due to big decrease in stock price • negative P/E ratio due to net loss • Big decline in P/B ratio due to stock price
Du Pont Analysis for EA A horrible ROE far behind average -29.12% compare to the industry average 8.04, also fall behind it’s competitors. PM (Profitability): -25.83% to 6.08% as a industry average Main reason for poor performance 2. Asset Turnover(Asset management): slightly above average 3.Equity Multiplier(Debt management)1.49 compare to industry average1.9 Below average, can make improvement try to rely more on debt managenment.
Operating efficiency • Declining Profit Margins due to Net Loss • Declining BEP due to Net loss & misuse of Assets • Positive Sales growth • Gross margin higher than competitors
Asset Management Ratios • TATO-above average, in the middle place. A • ITO- Compared to the industry average, Electronic Arts has very good Inventory turnover, and in fact has had better inventory turnover than all of the competition. • FATO- Electronic Arts hasn’t showed good efficiency and falls below all of its competitors. • DSO- Electronic Arts is very efficient when it comes to DSO, and is better than the competition.
Debt management for EA • Equity multiplier (1.49 compare to industry average 1.90) • Debt to Asset relatively stable and shows no problem in financing in asset Current ratio and Quick ratio well above average ratios, high liquidity ratios no problem in paying back short-term debt. Differences of these two ratios can show inventory turnover.
Summary and suggestion • Profitability—main problem of the company • A net loss due to high general administrative cost and selling prices-----Improve managing efficiency, reducing unnecessary expenses • Asset management– relative strong Improve is possible, especially in fixed asset • Debt management can rely more on issuing debt.