Download
1 / 15
260 likes | 581 Views
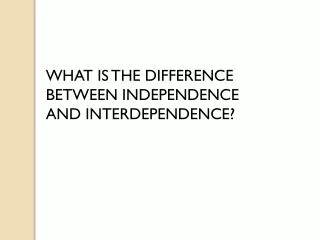
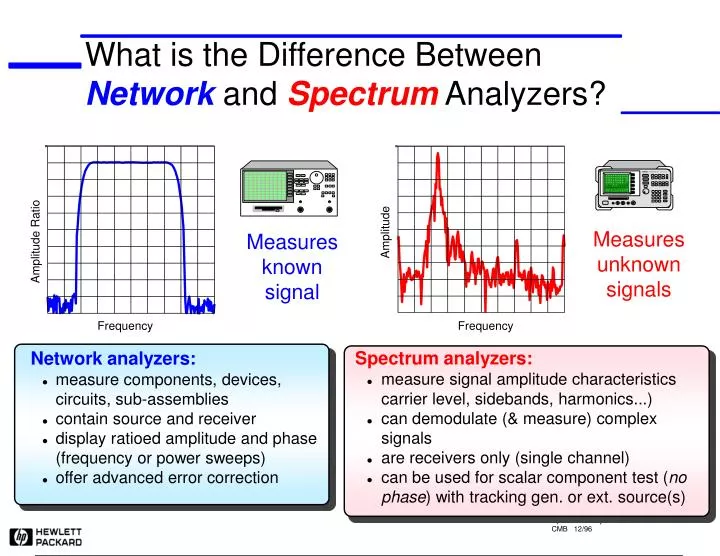
8563A. SPECTRUM ANALYZER 9 kHz - 26.5 GHz. Amplitude Ratio. Amplitude. Network analyzers: measure components, devices, circuits, sub-assemblies contain source and receiver display ratioed amplitude and phase (frequency or power sweeps) offer advanced error correction.

E N D
8563A SPECTRUM ANALYZER 9 kHz - 26.5 GHz Amplitude Ratio Amplitude Network analyzers: • measure components, devices, circuits, sub-assemblies • contain source and receiver • display ratioed amplitude and phase(frequency or power sweeps) • offer advanced error correction Spectrum analyzers: • measure signal amplitude characteristicscarrier level, sidebands, harmonics...) • can demodulate (& measure) complex signals • are receivers only (single channel) • can be used for scalar component test (nophase) with tracking gen. or ext. source(s) Frequency Frequency What is the Difference Between Network and Spectrum Analyzers? . Measures unknown signals Measures known signal
Overview Types of Tests Made Modulation Noise Distortion
Overview Frequency versus Time Domain Amplitude (power) frequency time Time domain Measurements Frequency Domain Measurements
f f 2 1 Overview Different Types of Analyzers Swept Analyzer Filter 'sweeps' over range of interest A CRT shows full spectral display f
Theory of Operation Spectrum Analyzer Block Diagram RF input attenuator IF gain IF filter detector mixer Input signal Log Amp Pre-Selector Or Low Pass Filter video filter local oscillator sweep generator Crystal Reference CRT display
MIXER + f f f - f sig sig LO LO f sig f f sig LO f LO Theory of Operation Mixer input RF IF LO
Theory of Operation IF Filter IF FILTER Input Spectrum IF Bandwidth (RBW) Display
Theory of Operation Detector DETECTOR amplitude "bins" Positive detection: largest value in bin displayed Negative detection: smallest value in bin displayed Sample detection: last value in bin displayed
Theory of Operation Video Filter VIDEO FILTER
Theory of Operation Other Components LO SWEEP GEN frequency CRT DISPLAY RF INPUT ATTENUATOR IF GAIN
f s f f f - f f LO + LO s LO s f s f s f IF f LO 0 1 2 3 (GHz) Theory of Operation How it all works together LO Range Signal Range 0 1 2 3 (GHz) IF filter 0 1 5 6 4 2 3 mixer detector 3.6 6.5 input 3.6 sweep generator A LO f 6 5 CRT display (GHz) 4 3 3.6 6.5
Specifications Sensitivity/DANL Effective Level of Displayed Noise is a Function of RF Input Attenuation signal level 10 dB Attenuation = 20 dB Attenuation = 10 dB Signal-To-Noise Ratio Decreases as RF Input Attenuation is Increased
10 dB 10 dB Specifications Sensitivity/DANL: IF Filter (RBW) Displayed Noise is a Function of IF Filter Bandwidth 100 kHz RBW 10 kHz RBW 1 kHz RBW Decreased BW = Decreased Noise
Specifications Sensitivity/DANL: VBW Video BW Smoothes Noise for Easier Identification of Low Level Signals
Specifications Sensitivity/DANL For Best Sensitivity Use: • Narrowest Resolution BW • Minimum RF Input Attenuation • Sufficient Video Filtering(Video BW < .01 Res BW)