Download
1 / 25
250 likes | 416 Views
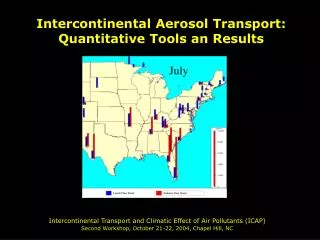
July. Intercontinental Aerosol Transport: Quantitative Tools an Results. Intercontinental Transport and Climatic Effect of Air Pollutants (ICAP) Second Workshop, October 21-22, 2004, Chapel Hill, NC. ??. Global Aerosol Pattern – NASA MISR Team.

E N D
July Intercontinental Aerosol Transport:Quantitative Tools an Results Intercontinental Transport and Climatic Effect of Air Pollutants (ICAP) Second Workshop, October 21-22, 2004, Chapel Hill, NC ??
Global Aerosol Pattern – NASA MISR Team • Sahara is the largest global aerosol source as evidenced by several satellite products • Sahara transport path touches the SE US, mostly in July • So, the quantification of intercontinental transport to the US is promising
Regional Haze Rule: Glide Path Toward ‘Natural Condition’ Natural haze is due to natural windblown dust, biomass smoke and other natural processes Man-made haze is due industrial activities AND man-perturbed smoke and dust emissions (A fraction of the man-perturbed smoke and dust is assigned to natural by policy decisions)
Origin of Fine Dust Events over the US Gobi dust in spring Sahara in summer US-scale fine dust events are mainly from intercontinental transport Fine Dust Events, 1992-2003 ug/m3
Direct Evidence Composition Temporal Pattern Spatial Pattern Wind Pattern Trajectory Observational Tools Establishing Aerosol Origin (Egen, 1835) Modern Methods – similar to century-old approaches but with more data • Direct Evidence. Photographic, satellite or compelling visual evidence of origin • Aerosol Composition. Chemical fingerprinting of different source types (speciation, traces) • Temporal pattern. Chemical Physical property analysis (satellite, ASOS, PM2.5) • Spatial Pattern. Chemical • Transport Pattern. Forward, backward trajectory, residence time analysis • Chemistry with Transport. Combining chemical fingerprinting and transport (CATT) • Dynamic modeling. Simulation model (forward, inversion) quantifying origin/transport • Historical Methods • Source attribution methods have been used for the past 2 centuries • A list of methods was given my Egen, 1835. See paper and PPT
Annual July Sahara and Local Dust Apportionment: Annual and July The Sahara and Local dust was apportioned based on their respect ive Al/Si ratios. • The maximum annual Sahara dust • In July the Sahara dust contributions are 4 - m m contribution is about 1 g.m 3 8 g.m 3 • In Florida, the local and Sahara dust • Throughout the Southeast, the Sahara dust contributions are about equal but at Big exceeds the local source contributions by Bend, the Sahara contribution is < 25%. w wide margin (factor of 2 - 4)
Temporal Scales of Aerosol Events • A goal of the FASTNET project is to detect and document natural aerosol events in the context of the overall PM pattern • Inherently, aerosol events are spikes in the time series of monitoring but the definition and documentation of events has been highly subjective • Temporal variation occurs at many scales from micro scale (minutes) to secular scale (decades) • At each scale the variation is dominated different combination of the key processes: emission, transport, transformations and removal • Natural aerosol events occur mostly at synoptic scale of 3-5 days
Dust US Seasonal + spikes East – west events are independent East events occur several times a year, mostly in summer West events are lest frequent, mostly in spring East West
Example high fine dust days (See console for complete list) Asian Dust April 16, 2001 Sahara Dust July 5, 2001 Southwestern Dust Oct. 16, 2001
Dust Western US - Dust Signal Components: Seasonal cycle, Synoptic ‘noise’ Event spikes Sulfate Western US - Sulfate West • Signal Components: • Seasonal cycle, • Synoptic ‘noise’ US
Seasonal Pattern of Dust Baseline and Events • The dust baseline concentration is has a 5x seasonal amplitude from 0.2 to 1 ug/m3 • The dust events (determined by the spike filter) occur in April/May and in July • The two April/May and the July peak in avg. dust is due to the events
Temporal Signal Decomposition and Event Detection EUS Daily Average 50%-ile, 30 day 50%-ile smoothing • First, the median and average is obtained over a region for each hour/day (thin blue line) • Next, the data are temporally smoothed by a 30 day moving window (spatial median - red line; spatial mean – heavy blue line). These determine the seasonal pattern. Event : Deviation > x*percentile Deviation from %-ile Average • Finally, the hourly/daily deviation from the the smooth median is used to determine the noise (blue) and event (red) components Median
TOMS and VIEWS, July • TOMS – Dust plume from Sahara
Seasonal Average Fine Soil (VIEWS database, 1992-2002) • Fine soil concentration is highest in the summer over Mississippi Valley, lowest in the winter • In the spring, high concentrations also exists in the arid Southwest (Arizona and Texas) • Evidently, the summer Mississippi Valley peak is Sahara dust while the Spring peak is from local (and Asian) sources
Combined Aerosol-Trajectory Tool (CATT) • High dust concentration (>7 ug/m3) in July all originate from Sahara • Lower concentration form local sources
Eastern US PM25 Event Composition • The largest EUS PM25 events (as RCFM) are simultaneously ‘events’ in sulfate, organics and soil! • Some EUS PM25 events are single species events • Some PM25 events are not events in any species; their reinforcing combination causes the PM25 event
Summary of Quantification Techniques • Direct evidence – satellite images • Chemical tracers of Sahara, Gobi & Local dust (Al, Si, Fe, K) • Temporal analysis – spikes are IC transport events • Spatial analysis – excess dust in the dust transport path • Spatio-temporal-chemical analysis with backtrajectories • The chemical, temporal and spatial analyses indicate a consistent estimate of 0.3 ug/m3 (2 ug/m3 in July) of fine dust over the SE US. • These tools are primarily for science (why, how) and not necessarily good for policy (what if.. ) • We are in the midst of an aerosol sensing revolution and it would be a bummer …
Analyst Consoles: Near-Real-Time Data Example: NE Sulfate Episode: 8/27/04 17:00UTC Sulfate in the Northeast Sahara Dust in the Gulf Fires in the Southeast Time Series Console: Southeast
Aerosol Event Catalog: Distributed Web pages Browser • Aerosol events appear any time and place and analyzed by many organizations. • The event info. is encoded, cataloged and accessed through Event Catalog • Each ‘event’ is given attributes: location and time of occurrence and aerosol type (dust, smoke, haze, other) • This allows graphic browsing of event-related information on maps and calendars and linking the info source, e.g. TNRCC. • Ideas on the Event Catalog (content, structure, interface, maintenance, etc) are welcome. Links to Distributed Analyst/Data Web page
DataFed.net Large Collection of Projects, Data, Tools. Where’s CATT “Start”? Kitty Start with Kitty:http://webapps.datafed.net/dvoy_services/datafed.aspx?view=Kitty
Aerosol Event Catalog: Web pages • Catalog of generic ‘web objects’ – pages, images, animations that relate to aerosol events • Each ‘web object’ is cataloged by location, time and aerosol type.