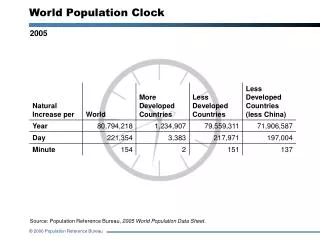
World population clock
World population clock. 7 billion. ESS January 9th. Cycles test/IAs – see me during tutorial Tuesday - Thursday - Friday – Field trip forms and money Field trip – Mangroves and Population This term – any work may be assessed . The course. Topic 1:


World population clock
E N D
Presentation Transcript
ESS January 9th Cycles test/IAs – see me during tutorial Tuesday - Thursday - Friday – Field trip forms and money Field trip – Mangroves and Population This term – any work may be assessed
The course Topic 1: Systems and models Topic 2: The ecosystem (2.6 and 2.7 to do) Topic 3: Human population, carrying capacity and resource use
Human population, carrying capacity and resource use
3.1 Population dynamics 3.1.1: Exponential growth 3.1.2: Population change • CBR • CDR • Fertility • Doubling time • Natural increase 3.1.3: The DTM and population pyramids 3.1.4: Models to predict population growth
The number of years a person is expected to live to, on average A graph which shows the age and sex structure of a country or area The length of time in years it takes for the population to double The number of deaths each year for every 1000 people in that country The number of babies that die before their 1st birthday, out of every 1000 babies born in a year The total number of children a woman has over her lifetime Things in the environment that reduce or stop population growth The number of babies born each year for every 1000 people in the country A graph which shows changes in CBR, CDR and total population over time Where the rate of growth increases as time goes on (i.e. a graph has a curved line not a straight one) The number of births for every 1000 women of childbearing age The maximum number of people an area can support sustainably The difference between the crude birth rate and the crude death rate (CBR – CDR) /10 (divided by 10 to give a %)
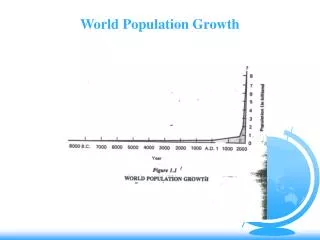
How has the world’s population changed over time? Draw a very quick line graph to show this information. How many years did it take the world’s population to increase from 1 billion to 2 billion? 2 billion to 3 billion? 3 billion to 4 billion? 4 billion to 5 billion? 5 billion to 6 billion? 6 billion to 7 billion? What is your estimate for the number of years to increase from 7 billion to 8 billion? What was the doubling time for 1 to 2 billion and 2 to 4 billion?
9. What evidence is there in the graph above that the world’s population growth may slow down?
10. In which 50 years did most growth take place?11. Is most of the growth in MEDCs or LEDCs?12. True/false: The rate of population growth has been increasing with time.
Why has there been a population explosion? Birth rate Death rate If the BR is greater than the DR we have population growth (natural increase).
The Demographic Transition Model • Each take one sheet – High BR, High DR, Low BR, Low DR – use these to complete the following table.
Deepta aged 9 works on a farm instead of going to school Parents start to think more about family planning Shakira has 7 brothers and sisters There are more Golden Weddings A mother sobs over the grave of the last of her 6 children who died in a typhoid epidemic A new highway has just been built connecting 2 towns to the port Many more houses are being built The Public Health Inspector smiles as the building of the new sewers are completed Fewer people share a bedroom Grandparents are rare People are encouraged to migrate to other countries to find employment Cheryl is promoted to Manager of the bank where she works. Demographic Transition Model
Big understanding: What are the population issues facing The Philippines? (8 marks)
The Philippines Use the CIA website to find out about three countries’ population data. LEDC / MEDC / Philippines Fill in your answers on the worksheet that follows – round all figures off to a sensible number
At the end: colour code: dark red for worst, green for best, orange/yellow for middle
The Philippines: watch the youtube clip “Sex and Religion”Questions to follow
The Philippines: sex and religion • Manila is fast growing / slow growing. • What products can be bought at the stall? What are they used for? • How many illegal abortions take place each year? • What is one side effect of these abortions? • Why do people blame the church for The Philippines’ population growth? • Are contraceptives given out by public health clinics? • Out of all the pregnant women in Manila, what proportion of the women wanted to get pregnant? • How large is the family in the film? What are the knock-on effects of this large family size on living space, poverty and education?
Get questionning… 16 people AB – 3 each pair in Manila, 3 again in Batangas 17 people EH – as above Aim: 50 in each area Give all questionnaires to Karenina Recording data: for ABs class: Reggie and Karenina for EHs class:
? Abortion in The Philippines • Watch first