Download
1 / 15
150 likes | 266 Views
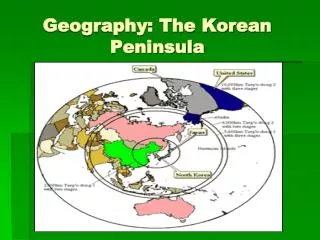
Estimating instability indices from MODIS infrared measurements over the Korean Peninsula B. J. Sohn 1 , Sung-Hee Park 1 , Eui-Seok Chung 1 , and Marianne Koenig 2 1 School of Earth and Environmental Sciences Seoul National University, Seoul, Korea sohn@snu.ac.kr

E N D
Estimating instability indices from MODIS infrared measurements over the Korean Peninsula B. J. Sohn1, Sung-Hee Park1, Eui-Seok Chung1, and Marianne Koenig2 1School of Earth and Environmental Sciences Seoul National University, Seoul, Korea sohn@snu.ac.kr 2EUMETSAT, Darmstadt, Germany
Instability Indices (II) II provides the air mass parameters that can be used for short term forecasting, in particular, severe storm warning. • Lifted Index: LI = Tobs - Tlifted from surface at 500 mb • K-Index: KI = (Tobs(850) - Tobs(500)) + TDobs(850) - (Tobs(700) - TDobs(700) ) • SK-Index: SKI = (Tobs(surface) - Tobs(500)) + TDobs(surface) - (Tobs(700) - TDobs(700) ) • KO-Index: KO = 0.5 * ( eobs(500) + eobs(700) - eobs(850) - eobs(1000) ) • Maximum Buoyancy Index: MB = eobs(maximum bet surface and 850) - eobs(minimum bet700 and 300)
Physical retrieval Interactive retrieval of the temperature and humidity profile (Rodgers, 1976; Ma et al., 1999) • xn+1= x0+(Sx-1+KnTSe-1Kn)-1 x KnTSe-1[(TB-TBn)+Kn(xn–x0)] • Profilevector xat an iteration step n can be obtained from: • x0: first guess profile • TB: observed EBBT • TBn: simulated TB for profile an an iteration step n • Sx: correlation matrix of first guess errors • Se: error covariance matrix of observed TB and of radiation model • Kn: Jacobians, change of EBBT with a changed profile: • Kn(m,i)=∂TBn(m)/∂xn(i), m: channel numbers, i: profile vector • EBBT = Equivalent Blackbody Brightness Temperature
Retrieval procedures 00 03 06 09 t X MODIS Observation Time • Forward model calculation to obtain EBBT • Fast model calculation using RTTOV-7 (Jacobian calculation for the derivative) • First guess field from the interpolation of KMA RDAPS forecast profiles (10 km resolution)
Flow chart MODIS IR TBs (TBobs, clear-sky) First guess profiles (RDAPS forecast data) TBcaln (RTM: RTTOV) TBcaln-TBobs< ε? No Updated T, q profiles Yes T, q profiles II calculation
MODIS channel TB simulation (0300UTC 27 Oct. 2003) Initial guess x0 Retrieved profiles : xn
Example of retrieved profiles (July 31, 2004, at Osan Korea)
Case 1: Frontal passage (27-28 Oct. 2003) Hourly rainfall (mm) GOES 7 IR Images
Case 1 (Cont.) (a) Surface weather map (b) GOES IR image (c) KI from GDAAC (d) LI from GDAAC From the night of 27 Oct to the morning of 28 Oct. 2003. Fig. (c) and (d) KI and LI from NASA GDAAC: They showed weak unstable conditions near the cloud edge but seemed to fail to predict thunderstorm shower associated with the frontal passage.
Case 1 (Cont.) Case 1 (Cont.) II from RDAPS profiles II from retrieved profiles 결과 – Case study(1) 결과 – Case study(1) 결과 – Case study(1)
Case 2 (31 July 2004) GOES VIS image Surface weather map KI from NASA GDAAC 결과 – Case study(1) ~1500 KST 31 July 2004 ~1100 KST 31 Jul 2004 • Convective storm in front of Typhoon Namtheun • Scattered convective storm over the peninsula • Forecasts on 31 July 2004 over the peninsula Central region – partly cloudy, Southern region – partly to mostly cloudy
Case 2 (Cont.) 11 KST 31 Jul 2004 12 KST 31 Jul 2004 13 KST 31 Jul 2004 14 KST 31 Jul 2004 15 KST 31 Jul 2004 16 KST 31 Jul 2004 17 KST 31 Jul 2004 18 KST 31 Jul 2004 19 KST 31 Jul 2004 KI from MODIS Rain gauge (mm/hr) GOES-9 VIS image 결과 – Case study(1) 11:15 KST 31 Jul 2004
Summary and conclusions • It was possible to derive air mass parameters with a satisfactory quality using a physical retrieval scheme. • It seems to produce better air mass parameters than currently produced II by NASA GDACC. • MODIS IR measurements may provide extra information to forecasters for the short-term forecasting. • MW measurements over the H2O and O2 bands and window region may be used for obtaining II over the cloudy area.
Approximate satellite passing time over Korea NOAA 17 NOAA 17 NOAA 16 NOAA 16 NOAA 15 NOAA 15 15 03 06 09 12 18 21 24 LST 0 LST NOAA 12/ AVHRR NOAA 12/ AVHRR Aqua Aqua Terra/Modis