Download
1 / 13
130 likes | 143 Views
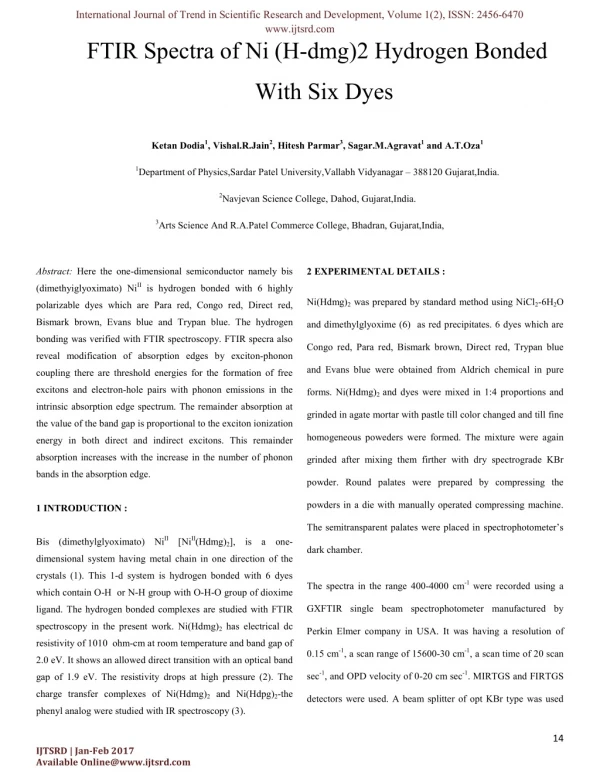
Here the one-dimensional semiconductor namely bis (dimethyiglyoximato) Ni?? is hydrogen bonded with 6 highly polarizable dyes which are Para red, Congo red, Direct red, Bismark brown, Evans blue and Trypan blue. The hydrogen bonding was verified with FTIR spectroscopy. FTIR specra also reveal modification of absorption edges by exciton-phonon coupling there are threshold energies for the formation of free excitons and electron-hole pairs with phonon emissions in the intrinsic absorption edge spectrum. The remainder absorption at the value of the band gap is proportional to the exciton ionization energy in both direct and indirect excitons. This remainder absorption increases with the increase in the number of phonon bands in the absorption edge. Ketan Dodiya | Sagar Agravat | A.T.Oza"FTIR Spectra of Ni (H-dmg)2 Hydrogen Bonded With Six Dyes" Published in International Journal of Trend in Scientific Research and Development (ijtsrd), ISSN: 2456-6470, Volume-1 | Issue-2 , February 2017, URL: http://www.ijtsrd.com/papers/ijtsrd63.pdf http://www.ijtsrd.com/other-scientific-research-area/physics/63/ftir-spectra-of-ni-h-dmg2-hydrogen-bonded-with-six-dyes/ketan-dodiya<br>

E N D
International Journal of Trend in Scientific Research and Development, Volume 1(2), ISSN: 2456-6470 www.ijtsrd.com FTIR Spectra of Ni (H-dmg)2 Hydrogen Bonded With Six Dyes Ketan Dodia1, Vishal.R.Jain2, Hitesh Parmar3, Sagar.M.Agravat1 and A.T.Oza1 1Department of Physics,Sardar Patel University,Vallabh Vidyanagar – 388120 Gujarat,India. 2Navjevan Science College, Dahod, Gujarat,India. 3Arts Science And R.A.Patel Commerce College, Bhadran, Gujarat,India, Abstract:Here the one-dimensional semiconductor namely bis (dimethyiglyoximato) NiΙΙ is hydrogen bonded with 6 highly 2 EXPERIMENTAL DETAILS : Ni(Hdmg)2 was prepared by standard method using NiCl2-6H2O polarizable dyes which are Para red, Congo red, Direct red, Bismark brown, Evans blue and Trypan blue. The hydrogen and dimethylglyoxime (6) as red precipitates. 6 dyes which are bonding was verified with FTIR spectroscopy. FTIR specra also Congo red, Para red, Bismark brown, Direct red, Trypan blue reveal modification of absorption edges by exciton-phonon and Evans blue were obtained from Aldrich chemical in pure coupling there are threshold energies for the formation of free excitons and electron-hole pairs with phonon emissions in the forms. Ni(Hdmg)2 and dyes were mixed in 1:4 proportions and intrinsic absorption edge spectrum. The remainder absorption at grinded in agate mortar with pastle till color changed and till fine the value of the band gap is proportional to the exciton ionization homogeneous poweders were formed. The mixture were again energy in both direct and indirect excitons. This remainder absorption increases with the increase in the number of phonon grinded after mixing them firther with dry spectrograde KBr bands in the absorption edge. powder. Round palates were prepared by compressing the powders in a die with manually operated compressing machine. 1 INTRODUCTION : Bis (dimethylglyoximato) NiΙΙ [NiΙΙ(Hdmg)2], is a one- The semitransparent palates were placed in spectrophotometer’s dark chamber. dimensional system having metal chain in one direction of the crystals (1). This 1-d system is hydrogen bonded with 6 dyes The spectra in the range 400-4000 cm-1 were recorded using a which contain O-H or N-H group with O-H-O group of dioxime GXFTIR single beam spectrophotometer manufactured by ligand. The hydrogen bonded complexes are studied with FTIR spectroscopy in the present work. Ni(Hdmg)2 has electrical dc Perkin Elmer company in USA. It was having a resolution of resistivity of 1010 ohm-cm at room temperature and band gap of 0.15 cm-1, a scan range of 15600-30 cm-1, a scan time of 20 scan 2.0 eV. It shows an allowed direct transition with an optical band sec-1, and OPD velocity of 0-20 cm sec-1. MIRTGS and FIRTGS gap of 1.9 eV. The resistivity drops at high pressure (2). The charge transfer complexes of Ni(Hdmg)2 and Ni(Hdpg)2-the detectors were used. A beam splitter of opt KBr type was used phenyl analog were studied with IR spectroscopy (3). 14 IJTSRD | Jan-Feb 2017 Available Online@www.ijtsrd.com
International Journal of Trend in Scientific Research and Development, Volume 1(2), ISSN: 2456-6470 www.ijtsrd.com having a range of 7800-370 cm-1.The spectra were recorded in band gap is plotted. Again band gap is found to decrease for purge mode. strong exciton-phonon coupling (Fig 5). 3 RESULTS AND DISCUSSION : The molecular structures of Ni(Hdmg)2 and six dyes are shown The excitonic threshold energies are observed in GaP (4,6), SiC (Figure 1). The hydrogen bonding occurs with O-H---O group of (7) and CdTe (8) and absorption edges were found to be dioxime ligand surrounding the metal ion in the centre. These are modified by exciton-phonon coupling. This coupling for direct bifurcated hydrogen bond because already one intramolecular O- excitons is discussed (8). Every atomic system has an infinite set H---O hydrogen bond exists. of discrete energy levels corresponding to finite motion of the electron. When the potential energy of the ineraction is The FTIR spectra of Ni(Hdmg)2-Para red, Ni(Hdmg)2-Congo red normalized to be zero at infinity, the total energy of the electron and Ni(Hdmg)2-Direct red are shown (Figure 2). Similar spectra is negative. For positive values of energy the electron is not of Ni(Hdmg)2-Bismark brown, Ni(Hdmg)2-Evans blue and Ni bound to the ion and is moving freely. The energy spectrum of (Hdmg)2-Trypan blue are also shown (Figure 3). free motion is continuous. Overlapping transitions into discrete and continuous regions of the energy spectrum prevent the The intrinsic absorption edge spectrum above 1700 cm-1 is absorption coefficient from turning zero when ћω=∆E0 (Eg).The analyzed by plotting (αhν)2, (αhν)1/2 , (αhν)1/3, (αhν)2/3 vs hν and absorption spectrum of direct allowed interband transition is finding the best fit. (αhν)1/3 vs hν was found to be the best fit givern by indicating (αhν)=A(hν-Eg)3 corresponding to forbidden indirect transition in all complexes except the Trypan blue complexes. In α=(2πe2/m0 2cwn)(2m* red/ћ2)3/2×|Pnn' (0)|2(E1 ex)1/2 (e2/sinhz) -- (1) Ni(Hdmg)2-Trypan blue, (αhν)=A(hν-Eg)1/2 an allowed direct ex/ ћw-∆E0)1/2 transition was found to be the best fit. These best fits are shown where z=π(E1 (Figure 4). The absorption edge is modified by exciton-phonon For ћw→∆E0 we obtain coupling. There are thereshold energies for the formation of excitons and electron-hole pairs with phonon emission. If the α(∆E0)=(4πe2/m0 2cwn)(2m* red/ћ2)3/2×|Pnn' (0)|2(E1 ex)1/2 ----- (2) exciton-phonon coupling is strong, there are less number of phonon emissions. If this coupling is weak, there are large e* the greater is α i.e.the greater the exciton ionization energy E1 number of phonon emissions. Here there are only two ex →0, α (∆E0)→0. and α takes the form at ∆E0 (Eg) . For E1 pronounced phonon bands in Bismark brown complex and there α~(ћw - ∆E0 )1/2 . For direct forbidden transitions the corrections are eight phonon bands in the case of Para red complex. Other obtained are similar. The theory of indirect exciton transitions cases are intermediate cases. The number of phonon bands vs has also been developed. There should be a well – defined long – 15 IJTSRD | Jan-Feb 2017 Available Online@www.ijtsrd.com
International Journal of Trend in Scientific Research and Development, Volume 1(2), ISSN: 2456-6470 www.ijtsrd.com wave boundary of the fundamental band. Actually the long – The pattern of the intrinsic absorption band edge for the exciton- wave edge of the fundamental absorption band is more or less phonon interband transitions in many solids may be described by spread out in the direction of ћw<∆E0 (Eg). The equations (1) the urbach equation valid for a wide range of α. and (2) are applied to trypan blue compex where direct transition α (ћw)= α0e-[σ(ћw-E0)/KBT] is observed. The theory of light absorption resulting in interband transitions The parameter E0 may be correlated with the energy maximum of electrons, coulomb interaction between electrons and holes of the exciton absorption band. This parameter coincides with created in the process of photon absorption is not taken into the value of the absorption coefficient in the maximum of the account. Coulomb attraction is instrumental in creating a bound exciton band. σ is in range 1-3. electron-hole system, the exciton, which has a hydrogen-like ex=Ec-(E1 ex/N2) below the discrete energy level systems EN The theory of optical abosorption by excitons was develop pad bottom of the conduction band. The fundamental state of the (9). Also the temperature dependence of the Urbach optical exciton is below Ec by the amount absorption edge was studied (10). A nearly universally observed feature of optical abosorption spectra near band edges in ex=(13.5/e2)(m*red/m0) eV E1 crystalline and amorphous semiconductors is the Urbach- In the course of direct interband transitions from the state k=kn a Martienssen absorption edge given by hole with wave vector kp=-k is created. since the exciton travels α (w)= α0 exp[{ћw-EG(T)}/E0(T)] as a whole, it follows that the motion of the electron and the hole is correlated and that their relative velocity is zero. This is Where ћw is the photon energy and EG and E0 are temperature- possible if the exciton springs from the transitions kn=kp=0, i.e. if dependent fitting parameters. E0 is the width of the tail. EG is the transitions take place in the centre of the Brillouin zone or comparable to the band gap energy. E0 is given by generally in the energy extrema. The range of states from which E0=[δlnα/δ(ћw)]-1 allowed electron transitions resulting in the generation of excitons are possible is quite narrow. This is the cause of and it is in the range 10-100 meV for amorphous formation of narrow absorption spectral bands adjoining the semiconductors. EG and E0 scales almost linearly. EG dereases as fundamental band from the long-wave side. The formation of E0 increases. There is a linear scaling relation (Figure 6). This is narrow discrete absorption bands is not the only modification of also supported by theory (10). the excition states. The exciton states are also responsible for the The theory for indirect excitons coupled with phonons is also modification of the intrinsic absorption band pattern. developed. The remainder absorption coefficient at E=EG 16 IJTSRD | Jan-Feb 2017 Available Online@www.ijtsrd.com
International Journal of Trend in Scientific Research and Development, Volume 1(2), ISSN: 2456-6470 www.ijtsrd.com remains finite and is proportional to the ionization energy of the (a) Ni(Hdmg)2-Para red exciton. Here the remainder absorption in percerntage is plotted (b) Ni(Hdmg)2-Congo red and (c) Ni(Hdmg)2-Direct red vs no. of phonon bands and vs band gap in eV (Figure 7). Figure 3 FTIR spectra of As band gap increases, the remainder absorption at hν=Eg (a) Ni(Hdmg)2-Bismark brown decreases. When exciton-phonon coupling is strong, the (b) Ni(Hdmg)2-Evans blue and remainder absorption at Eg is more. Since the remainder (c) Ni(Hdmg)2-Trypan blue. absorption at Eg is proportional to the ionization energy of exciton, this shows that the excitons with more ionization energy are strongly bound to phonons. Band gap is less when the Figure 4 (αhν)1/3 vs hν for exciton ionization energy is more. (a) Ni(Hdmg)2-Para red 4 CONCLUSION : (b) Ni(Hdmg)2-Congo red The FTIR spectra of Ni(Hdmg)2 with 6 dyes which are Para (c) Ni(Hdmg)2-Direct red red, Direct red, Congo red, Evans blue, Bismark brown and (d) Ni(Hdmg)2-Bismark brown Trypan blue have been studied. The intrinsic absorption edge (e) Ni(Hdmg)2-Evans blue and (αhν)2 vs hν for spectrum is modified with threshold energies of excitons by (f) Ni(Hdmg)2-Trypan blue. exciton-phonon coupling. The remainder absorption is found at Eg due to this coupling which is proportional to the ionization Figure 5 Number of phonon bands vs band gap (eV). energy of exciton. Excitons with higher ionization energies are Figure 6 (a) Band tailing analysis and focal point. strongly bound to phonons than those with less ionization (b) Eg vs E0 i.e. band gap vs width of the tail. energy. Band gap reduces with increase in ionization energy of excitons. Figure 7 (a) Number of phonon band vs remainder absorption at Eg. CAPTIONS OF THE FIGURES : (b) Band gap (eV) vs remainder absorption at Eg. Figure 1 Molecular structures of Ni(Hdmg)2 and six dyes. Figure 2 FTIR spectra of 17 IJTSRD | Jan-Feb 2017 Available Online@www.ijtsrd.com
International Journal of Trend in Scientific Research and Development, Volume 1(2), ISSN: 2456-6470 www.ijtsrd.com (Figure-2a) (Figure-2b) 14 IJTSRD | Jan-Feb 2017 Available Online@www.ijtsrd.com
International Journal of Trend in Scientific Research and Development, Volume 1(2), ISSN: 2456-6470 www.ijtsrd.com (Figure-2c) (Figure-3a) 15 IJTSRD | Jan-Feb 2017 Available Online@www.ijtsrd.com
International Journal of Trend in Scientific Research and Development, Volume 1(2), ISSN: 2456-6470 www.ijtsrd.com (Figure-3b) (Figure-3c) 16 IJTSRD | Jan-Feb 2017 Available Online@www.ijtsrd.com
International Journal of Trend in Scientific Research and Development, Volume 1(2), ISSN: 2456-6470 www.ijtsrd.com 1.8 1.6 1.4 1.2 (αhν)1/3 1 0.8 0.6 0.4 0.2 0 0 0.1 0.2 0.3 0.4 0.5 hν (eV) (Figure-4a) 2.5 2 1.5 (αhν)1/3 1 0.5 0 0 0.1 0.2 0.3 0.4 0.5 hν (eV) (Figure-4b) 17 IJTSRD | Jan-Feb 2017 Available Online@www.ijtsrd.com
International Journal of Trend in Scientific Research and Development, Volume 1(2), ISSN: 2456-6470 www.ijtsrd.com 2.5 2 1.5 (αhν)1/3 1 0.5 0 0 0.1 0.2 0.3 0.4 hν (ev) (Figure-4c) 2.5 2 1.5 (αhν)1/3 1 0.5 0 0 0.1 0.2 0.3 0.4 hν (ev) (Figure-4d) 18 IJTSRD | Jan-Feb 2017 Available Online@www.ijtsrd.com
International Journal of Trend in Scientific Research and Development, Volume 1(2), ISSN: 2456-6470 www.ijtsrd.com 2.5 2 1.5 (αhν)1/3 1 0.5 0 0 0.1 0.2 0.3 0.4 hν (eV) (Figure-4e) 2.5 2 1.5 (αhν)1/3 1 0.5 0 0 0.1 0.2 0.3 0.4 hν (eV) (Figure-4f) 19 IJTSRD | Jan-Feb 2017 Available Online@www.ijtsrd.com
International Journal of Trend in Scientific Research and Development, Volume 1(2), ISSN: 2456-6470 www.ijtsrd.com 0.3 0.25 Band gap (eV) 0.2 0.15 0.1 0.05 0 0 2 4 6 8 10 No. of phonon bands (Figure-5) 4 3.5 3 2.5 lnα 2 1.5 1 0.5 0 0 0.1 0.2 0.3 0.4 0.5 hν (eV) (Figure-6a) 20 IJTSRD | Jan-Feb 2017 Available Online@www.ijtsrd.com
International Journal of Trend in Scientific Research and Development, Volume 1(2), ISSN: 2456-6470 www.ijtsrd.com 0.3 0.25 0.2 Eg (eV) 0.15 0.1 0.05 0 0 20 40 60 80 100 120 E0 (meV) (Figure-6b) 18 16 14 12 10 α % 8 6 4 2 0 0 2 4 6 8 10 No. of phonon bands (Figure-7a) 21 IJTSRD | Jan-Feb 2017 Available Online@www.ijtsrd.com
International Journal of Trend in Scientific Research and Development, Volume 1(2), ISSN: 2456-6470 www.ijtsrd.com 18 16 14 12 10 α% 8 6 4 2 0 0 0.05 0.1 0.15 0.2 0.25 0.3 Band gap (eV) (Figure-7b) REFERENCES : 1.L.E.Godycki and R.E. Rundle, Acta cryst,6,487,1953. 2. A.T.Oza, Czech.J.Phys.,43,821,1993. 3. R.G.Patel and A.T.Oza,Ind.J.Phys.,74B,31,2000. 4. J.I.Pankove,Optical Processes in semiconductors,Prentice-Hall Inc.,Englewood Cliffs,New Jersey,1971(p.59). 5. M.Gershenzon, D.G.Thomas and R.E.Dietz, Proc.Int.Conf. on semiconductor Physics, Exeter, Inst. of Phys. and Phys.Soc.London,1962 (p.752). 6. P.J.Dean and D.G.Thomas,Phys.Rev.150,690,1966. 7. A.P.Hrokhmal, Semiconductors,37,279,2003. 8. P.S.Kireev, Semiconductor Physics, Mir Publishers, Moscow,1974 (P.553). 9. R.J.Elliott, Phys.Rev.108,1384,1957. 10. C.H.Grain and Sajeev John, Phys.Rev,B,39,1149,1989. 22 IJTSRD | Jan-Feb 2017 Available Online@www.ijtsrd.com