Download

1 / 6
60 likes | 70 Views
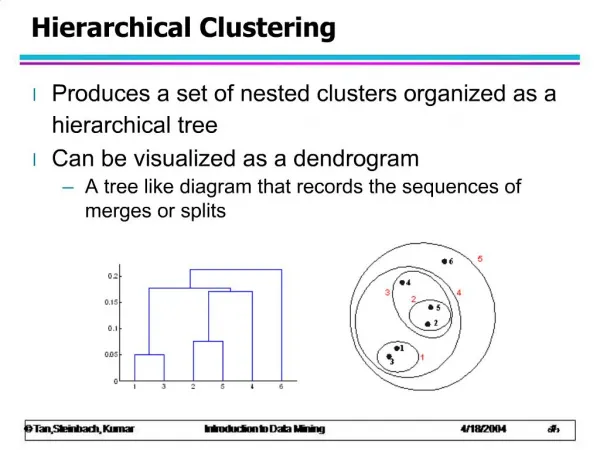
Educational data mining emphasizes on developing algorithms and new tools for identifying distinctive sorts of data that come from educational settings, to better understand students. The objective of this paper is to cluster efficient students among the students of the educational institution to predict placement chance. Data mining approach used is clustering. Ablend of heuristic and K means algorithm is employed to cluster students based on KSA knowledge, Communication skill and attitude . To assess the performance of the program, a student data set from an institution in Bangalore were collected for the study as a synthetic knowledge. A model is proposed to obtain the result. The accuracy of the results obtained from the proposed algorithm was found to be promising when compared to other clustering algorithms. Ashok. M. V | G. Hareesh Kumar "Educational Data Mining: A Blend of Heuristic and K-Means Algorithm to Cluster Students to Predict Placement Chance" Published in International Journal of Trend in Scientific Research and Development (ijtsrd), ISSN: 2456-6470, Volume-2 | Issue-6 , October 2018, URL: https://www.ijtsrd.com/papers/ijtsrd18882.pdf Paper URL: http://www.ijtsrd.com/computer-science/data-miining/18882/educational-data-mining-a-blend-of-heuristic-and-k-means-algorithm-to-cluster-students-to-predict-placement-chance/ashok-m-v<br>

E N D
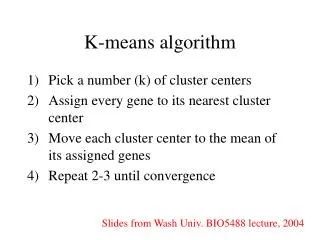
International Journal of Trend in International Open Access Journal International Open Access Journal | www.ijtsrd.com International Journal of Trend in Scientific Research and Development (IJTSRD) Research and Development (IJTSRD) www.ijtsrd.com ISSN No: 2456 ISSN No: 2456 - 6470 | Volume - 2 | Issue – 6 | Sep 6 | Sep – Oct 2018 Educational Data Mining: A Blend of Heuristic and K Algorithm to Cluster Students t to Cluster Students to Predict Placement Chance ucational Data Mining: A Blend of Heuristic and K ucational Data Mining: A Blend of Heuristic and K-Means o Predict Placement Chance Ashok. Ashok. M. V1, G. Hareesh Kumar2 1M. Tech, 2Assistant Professor f CSE, BIT Institute of Technology, Andhra Pradesh, India Department of CSE, BIT Institute Andhra Pradesh, India ABSTRACT Educational data mining emphasizes on developing algorithms and new tools for identifying distinctive sorts of data that come from educational settings, to better understand students. The objective of this paper is to cluster efficient students among the students of the educational institution to predict placement chance. Data mining approach used is clustering. Ablend of heuristic and K-means algorithm is employed to cluster students based on KSA (knowledge, Communication skill and attitude). To assess the performance of the program, a student data set from an institution in Bangalore were collected for the study as a synthetic knowledge. A model is proposed to obtain the result. The accuracy of the results obtained from the proposed algorithm was found to be promising when compared to other clustering algorithms. Keyword: Educational data mining, clustering, efficient student, heuristic, K-means, KSA concept 1.INTRODUCTION Educational data mining (EDM) is the presentation of Data Mining (DM) techniques to educational data, and so, its objective is to examine these sorts of data in order to resolve educational research issues. An institution consists of many students. For the students to get placed, he/she ought to have smart score in KSA. KSA is knowledge, communication skills and attitude. This is often one of the vital criteria used for choosing student for placement. also a proven fact that better placements end up in good admissions. All the students will not have high KSA score. Therefore, it's necessary to find those students who possess smart KSA and who don’t. Therefore, there's a requirement for clustering to Therefore, there's a requirement for clustering to eliminate students who don't seem to be competent to be placed. 2.PROBLEM STATEMENT Normally many students are there in institut a tedious task and time consuming to predict placement chance for all students and it's not necessary additionally to predict placement chance for those students who are incompetent academically. Therefore, there's a necessity for clustering th efficient students having smart KSA score whose placement chance may be predicted. 3.RELATED WORKS Performance appraisal system is basically an interaction between an employee and also the supervisor or management and is periodically conducted to identify the areas of strength and weakness of the employee. The objective is to be consistent regarding the strengths and work on the weak areas to boost performance of the individual and therefore accomplish optimum quality of the process. [8]. (Chein and Chen, 2006 [9] Pal and Pal, 2013[10]. Khan, 2005 [11], Baradwaj and Pal, 2011 [12], Bray [13], 2007, S. K. Yadav et al., 2011[14]. K one amongst the best and accurate clustering algorithms. This has been applied to varied issues. K means approach cut samples apart into K primitive clusters. This approach or technique is particularly appropriate once the quantity of observations is huge or the file is gigantic. Wu, 2000 is wide utilized in segmenting markets. (Kim et al., 2006[2]; Shin & Sohn, 2004 [3]; Jang et al., 2002[4]; Hruschka & amp; natter, 1999[5]; K cluster may be a variation of k refines cluster assignments by repeatedly making an attempt to subdivide, and keeping the simplest attempt to subdivide, and keeping the simplest Educational data mining emphasizes on developing algorithms and new tools for identifying distinctive sorts of data that come from educational settings, to better understand students. The objective of this paper eliminate students who don't seem to be competent to PROBLEM STATEMENT Normally many students are there in institutions. It is a tedious task and time consuming to predict placement chance for all students and it's not necessary additionally to predict placement chance for those students who are incompetent academically. Therefore, there's a necessity for clustering the efficient students having smart KSA score whose placement chance may be predicted. ong the students of the educational institution to predict placement chance. Data mining approach used is clustering. means algorithm is employed to cluster students based on KSA (knowledge, Communication skill and attitude). To ssess the performance of the program, a student data set from an institution in Bangalore were collected for the study as a synthetic knowledge. A model is proposed to obtain the result. The accuracy of the results obtained from the proposed algorithm was found to be promising when compared to other Performance appraisal system is basically an interaction between an employee and also the supervisor or management and is periodically the areas of strength and weakness of the employee. The objective is to be consistent regarding the strengths and work on the weak areas to boost performance of the individual and therefore accomplish optimum quality of the process. 2006 [9] Pal and Pal, 2013[10]. Khan, 2005 [11], Baradwaj and Pal, 2011 [12], Bray [13], 2007, S. K. Yadav et al., 2011[14]. K-means is one amongst the best and accurate clustering algorithms. This has been applied to varied issues. K- mples apart into K primitive clusters. This approach or technique is particularly appropriate once the quantity of observations is huge or the file is gigantic. Wu, 2000 [1]. K-means method is wide utilized in segmenting markets. (Kim et al., Sohn, 2004 [3]; Jang et al., amp; natter, 1999[5]; K-means cluster may be a variation of k-means cluster that refines cluster assignments by repeatedly making an Educational data mining, clustering, means, KSA concept Educational data mining (EDM) is the presentation of ques to educational data, and so, its objective is to examine these sorts of data in order to resolve educational research issues. An institution consists of many students. For the students to get placed, he/she ought to have smart owledge, communication skills and attitude. This is often one of the vital criteria used for choosing student for placement. It's also a proven fact that better placements end up in good admissions. All the students will not have high it's necessary to find those students who possess smart KSA and who don’t. @ IJTSRD | Available Online @ www.ijtsrd.com www.ijtsrd.com | Volume – 2 | Issue – 6 | Sep-Oct 2018 Oct 2018 Page: 1401
International Journal of Trend in Scientific Research and Development International Journal of Trend in Scientific Research and Development (IJTSRD) ISSN: 2456 (IJTSRD) ISSN: 2456-6470 ensuing splits, till some criterion is reached. Dan pelleg, andrewMore, K-means: Extended K which is an effective Estimation of the quantity of Clusters [6], Thomas aloe, Remi Servien, The K algorithm: a parameter-free method to perform unsupervised clustering [7]. 4.METHODOLOGY some criterion is reached. Dan means: Extended K-means Concept and research framework The methodology along with its computational processes for determining the efficient student, is Concept and research framework The methodology along with its computational processes for determining the efficient student, is outlined below: Step 1: Data collection. The goal is to identify proficient st college under consideration viz., KK for the year 2017-18.The students hail from numerous courses. The courses are MBA, MCA, BCA, B.Com, and BBA. Step 2: Data pre-processing using normalization In our study, the attribute ‘percent’ is me and ‘skill’ using numbers starting from [1 to 10]. In our study percentage (%) prevails on skills. Therefore, there's a necessity for standardization or normalization. Step 3: Proposed Clustering technique This step clusters efficient student students of the institution using proposed clustering algorithm. Step 4: Evaluate the result which is an effective Estimation of the quantity of Clusters [6], Thomas aloe, Remi Servien, The K-Alter free method to perform The goal is to identify proficient students within the college under consideration viz., KK for the year 18.The students hail from numerous courses. The courses are MBA, MCA, BCA, B.Com, and processing using normalization In our study, the attribute ‘percent’ is measured in (%) and ‘skill’ using numbers starting from [1 to 10]. In our study percentage (%) prevails on skills. Therefore, there's a necessity for standardization or Step 3: Proposed Clustering technique This step clusters efficient students among all the students of the institution using proposed clustering Fig 1: Proposed Methodology 5.DATA DESCRIPTION Fig 1: Proposed Methodology Table 1: Database Description Table 1: Database Description Description Id of the student Name of the Student Subject Name Marks scored in each subject Total marks (Communication skills+Attitude) score out of 10 {1, 2, 3, 4, 5...10} Minimum Marks for passing a subject Maximum Marks for passing a subject Variables Stu id Name Sub M1, M2, M3, M4…Marks scored in each subject T in % Total marks Skill (Communication skills+Attitude) score out of 10 Min Minimum Marks for passing a subject Max Maximum Marks for passing a subject Possible Values {Int} EKT} {TEKT} {1, 2, 3, 4, 5...100} Possible Values {Int} {TEKT} {TEKT} {1, 2, 3, 4, 5...100} { 1% { 1% - 100% } {1, 2, 3, 4, 5...10} Id of the student Name of the Student Subject Name 32 100 Stu_Id:– ID of the student. It can take any integer Name: - Name of the student. Sub: – represents the name of the topic. It will take solely the values starting from A M1, M2, M3..:–various subject marks scored by a student. It will take solely the numeric values from 0 to 100. T: – total marks scored by every student depicted within the form percentage i.e., 1% to 100%. Skill: – Communication and attitude score out of ten Min: - Minimum marks for passing a subject Max: - maximum marks for passing a subject ID of the student. It can take any integer values. represents the name of the topic. It will take solely the values starting from A marks scored by a student. It will take solely the numeric values from 0 to 100. total marks scored by every student depicted within the form percentage i.e., 1% to 100%. Communication and attitude score out of ten assing a subject maximum marks for passing a subject represents the name of the topic. It will take solely the values starting from A-Z. marks scored by a student. It will take solely the numeric values from 0 to 100. total marks scored by every student depicted within the form percentage i.e., 1% to 100%. @ IJTSRD | Available Online @ www.ijtsrd.com www.ijtsrd.com | Volume – 2 | Issue – 6 | Sep-Oct 2018 Oct 2018 Page: 1402
International Journal of Trend in Scientific Research and Development International Journal of Trend in Scientific Research and Development (IJTSRD) ISSN: 2456 (IJTSRD) ISSN: 2456-6470 6.EXPERIMENTAL EVALUATION Step 1: Data collection EXPERIMENTAL EVALUATION Table 2: Input Table 1 Vikas Guru Sayed Deepak … MaK M1 M2 100 20 98 100 23 98 100 24 97 100 25 96 100 26 95 100 28 90 … … … 25 90 7 9 Stu id Name Sub Ca Bi Java Se Cf Db … T in % Skill 2 3 4 …. Min 32 32 32 32 32 32 … M3 45 69 67 89 88 56 … 65 7 M4 92 83 74 92 88 81 … 80 8 M5 … … … … … … … … r 2017-18 is considered and M5 Fields or variables listed higher than Marks scored in selected subjects for the yea collected from an institution in city. Step 2: Data Pre-processing: Pre-processing is done using Normalization. Table 3: Pre-processed table Stu id 1 2 3 4 Sub M1 M2M3 M4 Ca 20 98 45 92 Bi 23 98 69 83 Java 24 97 67 74 Se 25 96 89 92 Cf 26 95 88 88 Db 28 90 56 81 … … .. … … T in % Skill 7 9 7 8 Steps of the proposed algorithm are explained below: Step 1: Clustering using proposed algorithm. Step 1.1: Pre-processed table are going to be the input. Step 1.2: Cluster efficient students and determine the precise number of clusters. K calculated using heuristic method by incrementing the K-value in each step by one and the results are shown below. Partition of ECS is finished at first by taking K=2 After Applying proposed algorithm with got Fields or variables listed higher than Marks scored in selected subjects for the year 2017 Table- 4: Partial view of clusters of students, for K=2 Cluster1 Cluster2 1 10 11 12 13 16 18 21 22 24 26 27 29 30 view of clusters of students, for K=2 Cluster2 2 3 4 5 6 7 8 9 14 15 17 19 20 23 25 28 processing is done using Normalization. processed table … M5 … … … … … … … 25 9065 80 … … explained below: Clustering using proposed algorithm. are going to be the The above table 4 shows the grouping of students into two groups. Table - 5: Difference between clusters for K=2 Cluster Cluster1 Custer 1 0 Custer 2 0. 229 For K=2, group distances are tabulated rounded value 0.23 is the minimum. Applying K-means for k=3, we've the subsequent results. 4 shows the grouping of students into Cluster efficient students and determine of clusters. K-value is calculated using heuristic method by value in each step by one and the results are shown below. 5: Difference between clusters for K=2 Cluster1 Cluster2 0.229 0 0. 229 finished at first by taking K=2 For K=2, group distances are tabulated. In this the minimum. algorithm with K=2, we've means for k=3, we've the subsequent @ IJTSRD | Available Online @ www.ijtsrd.com www.ijtsrd.com | Volume – 2 | Issue – 6 | Sep-Oct 2018 Oct 2018 Page: 1403
International Journal of Trend in Scientific Research and Development International Journal of Trend in Scientific Research and Development (IJTSRD) ISSN: 2456 (IJTSRD) ISSN: 2456-6470 Table- 6: Partial view of three clusters, for K=3 Cluster1 Cluster2 1 2 10 3 11 4 12 5 13 6 16 7 18 8 21 9 22 14 24 15 26 17 27 19 29 20 30 23 25 28 Cluster 1 Cluster 2 Cluster 3 1 9 10 24 11 12 13 16 18 21 22 26 27 29 30 The above table-6 indicates the partial view of 3 clusters. 6: Partial view of three clusters, for K=3 Table- 8: Partial view of four clust Cluster 1 Cluster 2 Cluster 3 1 9 10 11 12 13 16 18 21 22 24 26 27 29 30 8: Partial view of four clusters, for K=4 Cluster 3 Cluster 4 3 4 5 6 7 8 14 15 17 19 20 23 25 28 2 Table- 9: Comparison of distance between the clusters Cluster 1 2 Custer 1 Custer 2 Custer 3 Custer 4 9: Comparison of distance between the clusters Cluster 3 Cluste Cluster Cluster Cluster 4 Cluster 2 3 4 5 6 7 8 14 15 17 19 20 23 25 28 28 3 3 0 0.104 0.104 0.187 0.342 5 0. 104 0 0.083 0.238 7 0.187 0.083 0.083 0 0.154 14 15 17 19 20 23 25 0.342 0.238 0.238 0.154 0 Comparative table given above displays the distance between the clusters. Table clusters in terms of distance between them. Cluster 3 cluster 1 =0.187 given in row 1 column 4.Similarly, the other values are calculated. This table is the resultant of application of Proposed Algorithm, incrementing value of K in every step by 1. Table- 10: Cluster distance table Number of clustersThe short Cluster distance Cluster 2 Cluster 3 Cluster 4 Cluster 5 The first value 0.2293 within the shorter cluster distance field represents the distance between the cluster 1and 2, similarly the second value viz., 0.1658 represents the gap between 1 and 3. The opposite values within the table are often interpreted similarly. Comparative table given above displays the distance - 9 compares the two terms of distance between them. Cluster 3- cluster 1 =0.187 given in row 1 column 4.Similarly, the other values are calculated. This table is the resultant of application of Proposed Algorithm, incrementing value of K in every step by 1. 6 indicates the partial view of 3 - r distance table The short Cluster distance 0.2293 0.1658 0.3428 0.3133 Table- 7: Differences between clusters Cluster Cluster1 Cluster2 Cl Custer 1 0 Custer 2 0.116 Custer 3 0.165 7: Differences between clusters Cluster3 0.165 0.154 0 0.116 0 0.154 The first value 0.2293 within the shorter cluster distance field represents the distance between the the second value viz., 0.1658 represents the gap between 1 and 3. The opposite values within the table are often interpreted similarly. For K=3, the distance between the groups are tabulated. In this0.12 (rounded) is the minimum value For K=4; we have the following results. For K=3, the distance between the groups are rounded) is the minimum value @ IJTSRD | Available Online @ www.ijtsrd.com www.ijtsrd.com | Volume – 2 | Issue – 6 | Sep-Oct 2018 Oct 2018 Page: 1404
International Journal of Trend in Scientific Research and Development International Journal of Trend in Scientific Research and Development (IJTSRD) ISSN: 2456 (IJTSRD) ISSN: 2456-6470 From the above table 10 it is determined that, values within the ‘shorter cluster distance’ attribute starts increasing by great extent i.e., from 0.1658 to 0.3428, after cluster 2.Hence conclusion can be drawn that utmost number clusters which will be formed is 3. Step 2: Choosing the cluster We selectK=3 and 3rd cluster as a result. This is because the centroid of the third cluster is nearest to maximum marks of the subjects i,e., 2000(20 subjects). Step 3: Identifying the elements of the cluster Table- 11: Elements of Cluster 3 Cluster 3 The table 11 above represents the elements of the best cluster identified. 7.Results Cluster 3 is found to be the best cluster having the number of efficient students given below: Table- 12: Elements of Cluster 3 Cluster 3 Calculation of Precision and Recall for Proposed Algorithm and Other clustering algorithms To analyse the accuracy of proposed algorithm in comparison with other clustering algorithms like K means fast and K-Medoids it is necessary to identify the number of elements placed corre incorrectly into the clusters. Following formulae are used to calculate accuracy, precision and recall. Accuracy = (TA + TB) / (TA + TB + FA + FB), Precision = TA / (TA + FA) & Recall = TA / (TA + FB). TA and TB represent the elements that are placed correctly in class A and B, whereas FA and FB represent elements that are placed incorrectly in class A and B. Table- 13: Comparison of precision, recall and accuracy for various algorithms Algorithm PrecisionRecallAccuracy Proposed Algorithm k-medoids 0.87 k-means fast 0.85 From the above table 10 it is determined that, values within the ‘shorter cluster distance’ attribute starts reasing by great extent i.e., from 0.1658 to 0.3428, after cluster 2.Hence conclusion can be drawn that utmost number clusters which will be formed is 3. By the data available in table-13, it can be observed that the Accuracy, precision and recall values are By the data available in table that the Accuracy, precision and recall values are comparatively better for proposed algorithm. comparatively better for proposed algorithm. We selectK=3 and 3rd cluster as a result. This is of the third cluster is nearest to maximum marks of the subjects i,e., 2000(20 Identifying the elements of the cluster 11: Elements of Cluster 3 1: Precision, Recall and Accuracy for different algorithms are represented in the above Chart -1: Precision, Recall and Acc different algorithms are represented in the above graph graph 2 3 4567814151719 20 23 25 28 e elements of the best 8.CONCLUSION The main objective was to identify efficient students by clustering i.e, a blend of heuristic and K algorithm based on KSA concept using data mining approach. An algorithm was proposed to accomplish the same. It was found that cluster 3 having efficient students emerged among the students of the institution as the best cluster. Proposed algorithm was compared with other clustering algorithms and it is observed that Proposed algorithm outperformed other algorithms with an accuracy of 91.41%. Thus, the solution for the above problem was found with success REFERENCES 1.Kim, S. Y., Jung, T. S., Suh, E. H., & Hwang, H. S. (2006). Student segmentation and strategy development based on student lifetime value: A case study. EKpertSystemswith Applications, 31(1), 101–107. 2.Shin, H. W., &Sohn, S. Y. (2004). Product differentiation and market segmentation as alternative marketing strategies. EKpert Systems with Applications, 27(1), 2 3.Jang, S. C., Morrison, A. M. T., & O’Leary, J. T. (2002). Benefit segmentation of Japanese pleasure travelers to the USA and Canada: Selecting target markets based on the profitability and the risk of individual market segment. Tourism Management, 23(4), 367–378. 4.Hruschka, H., & Natter, M. (1999). Comparing performance of feed forward neural nets and k performance of feed forward neural nets and k- The main objective was to identify efficient students by clustering i.e, a blend of heuristic and K-means algorithm based on KSA concept using data mining rithm was proposed to accomplish the same. It was found that cluster 3 having efficient students emerged among the students of the institution as the best cluster. Proposed algorithm was compared with other clustering algorithms and it is observed that posed algorithm outperformed other algorithms with an accuracy of 91.41%. Thus, the solution for the with success. Cluster 3 is found to be the best cluster having the number of efficient students given below: 12: Elements of Cluster 3 19 20 23 25 2 3 4567814151719 8. 28 and Recall for Proposed Algorithm and Other clustering algorithms To analyse the accuracy of proposed algorithm in comparison with other clustering algorithms like K- Medoids it is necessary to identify the number of elements placed correctly and Kim, S. Y., Jung, T. S., Suh, E. H., & Hwang, H. S. (2006). Student segmentation and strategy based on student lifetime value: A case study. EKpertSystemswith Applications, Following formulae are used to calculate accuracy, precision and recall. Accuracy = (TA + TB) / (TA + TB + FA + FB), Precision = TA / (TA + FA) & Recall = TA / (TA + FB). TA and TB represent the elements that are ced correctly in class A and B, whereas FA and FB represent elements that are placed incorrectly in class Shin, H. W., &Sohn, S. Y. (2004). Product differentiation and market segmentation as alternative marketing strategies. EKpert Systems with Applications, 27(1), 27– 33. Jang, S. C., Morrison, A. M. T., & O’Leary, J. T. (2002). Benefit segmentation of Japanese pleasure travelers to the USA and Canada: Selecting target markets based on the profitability and the risk of individual market segment. Tourism Management, 13: Comparison of precision, recall and accuracy for various algorithms Accuracy 0.90 0.88 91.41 0.70 0.81 77.46 84.40 Hruschka, H., & Natter, M. (1999). Comparing @ IJTSRD | Available Online @ www.ijtsrd.com www.ijtsrd.com | Volume – 2 | Issue – 6 | Sep-Oct 2018 Oct 2018 Page: 1405
International Journal of Trend in Scientific Research and Development International Journal of Trend in Scientific Research and Development (IJTSRD) ISSN: 2456 (IJTSRD) ISSN: 2456-6470 means of cluster-based market segmentation. European Journal of Operational Research, 114(3), 346–353. 5.Leon Bottou, YoshuaBengio, “Convergence Properties of the K-Means Algorithms”, Advances in Neural Information Processing Systems 7, 1995. 6.Dan pelleg, Andrew Moree,"K-means: EKtending K- means with Efficient Estimation of the Number of Clusters" 7.Thomas Laloe, Remi Servien, "The K algorithm : a parameter-free method to perform unsupervised clustering" 8.Archer-North and Associates, “Performance Appraisal”, appraisal.com, 2006, Accessed Dec, 2012. 9.Chein, C., Chen, L., "Data mining to improve personnel selection and enhance human case study in high technology industry", EKpert Systems with Applications, In Press (2006). 10.K. Pal, and S. Pal, “Analysis and Mining of Educational Data for Predicting the Performance based market segmentation. of Students”(IJECCE) International Journal of Electronics Communication Engineering, Vol. 4, Issue 5, pp. 1560 ISSN: 2278-4209, 2013. 11.Z. N. Khan, “Scholastic achievement of higher secondary students in science stream”, Journal of Social Sciences, Vol. 1, No. 2, pp. 84 12.B.K. Bharadwaj and S. Pal. “Mining Educational Data to Analyze International Journal of Advance Computer Science and Applications (IJACSA), Vol. 2, No. 6, pp. 63-69, 2011. 13.M. Bray, The shadow education system: private tutoring and its implications for ed.), UNESCO, PARIS, France, 2007. 14.S. K. Yadav, B.K. Bharadwaj and S. Pal, “Data Mining Applications: A comparative study for Predicting Student’s Performance”, International Journal of Innovative Technology and Creative Engineering (IJITCE), Vol. 1, No. 12, pp. 13 2011. of Students”(IJECCE) International Journal of munication Engineering, Vol. 4, Issue 5, pp. 1560-1565, European Journal of Operational Research, and and Computer Computer Leon Bottou, YoshuaBengio, “Convergence Means Algorithms”, Advances in Neural Information Processing Systems 7, Z. N. Khan, “Scholastic achievement of higher secondary students in science stream”, Journal of Social Sciences, Vol. 1, No. 2, pp. 84-87, 2005. means: EKtending S. Pal. “Mining Educational means with Efficient Estimation of the Number Data International Journal of Advance Computer Science and Applications (IJACSA), Vol. 2, No. to Analyze Students’ Students’ Performance”, Performance”, Thomas Laloe, Remi Servien, "The K-Alter free method to perform M. Bray, The shadow education system: private tutoring and its implications for planners, (2nd ed.), UNESCO, PARIS, France, 2007. North and Associates, “Performance Appraisal”, http://www.performance http://www.performance- 2006, Accessed Dec, 2012. S. K. Yadav, B.K. Bharadwaj and S. Pal, “Data Mining Applications: A comparative study for Predicting Student’s Performance”, International Journal of Innovative Technology and Creative ), Vol. 1, No. 12, pp. 13-19, Chein, C., Chen, L., "Data mining to improve personnel selection and enhance human capital: A case study in high technology industry", EKpert Systems with Applications, In Press (2006). K. Pal, and S. Pal, “Analysis and Mining of Educational Data for Predicting the Performance @ IJTSRD | Available Online @ www.ijtsrd.com www.ijtsrd.com | Volume – 2 | Issue – 6 | Sep-Oct 2018 Oct 2018 Page: 1406