Download
1 / 5
50 likes | 53 Views
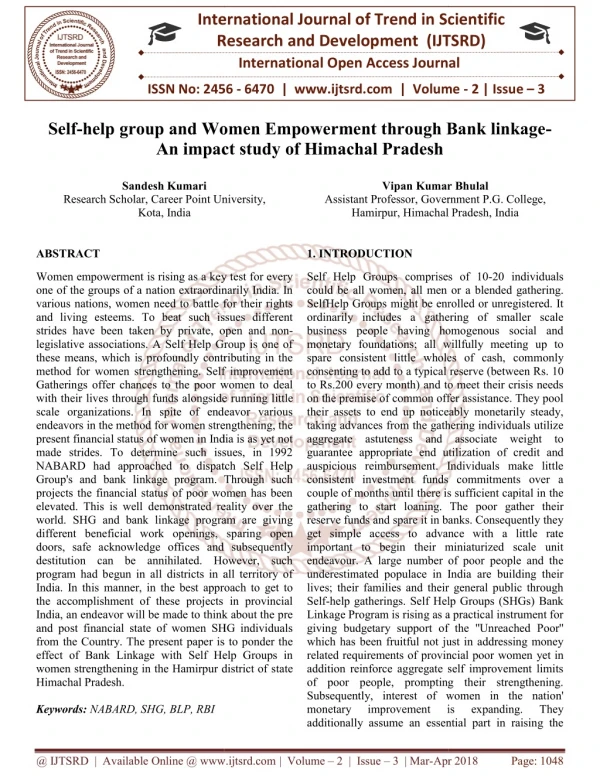
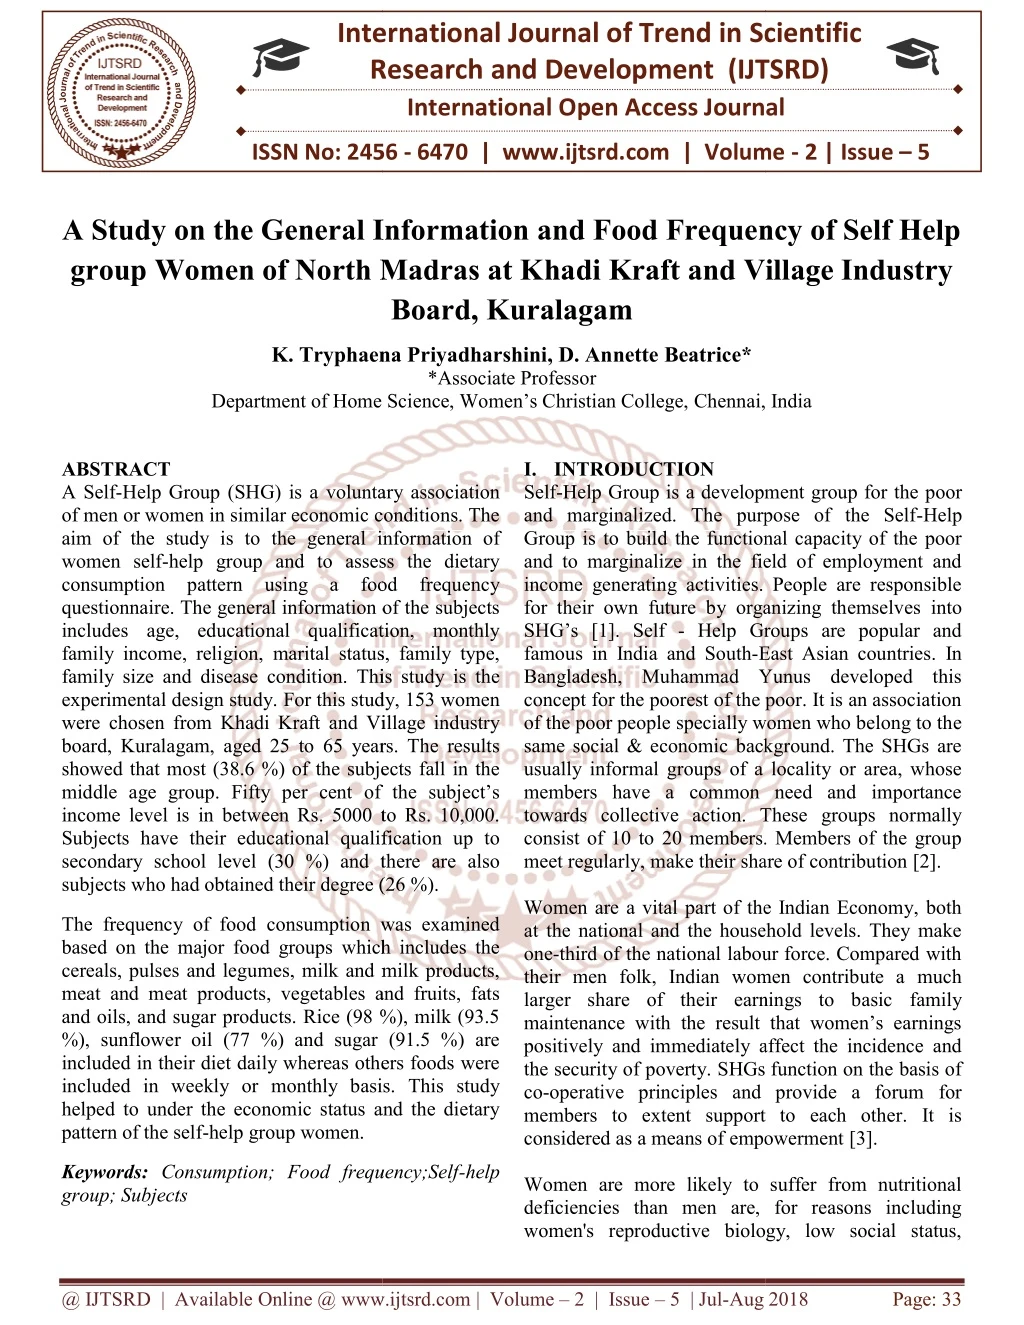
A Self Help Group SHG is a voluntary association of men or women in similar economic conditions. The aim of the study is to the general information of women self help group and to assess the dietary consumption pattern using a food frequency questionnaire. The general information of the subjects includes age, educational qualification, monthly family income, religion, marital status, family type, family size and disease condition. This study is the experimental design study. For this study, 153 women were chosen from Khadi Kraft and Village industry board, Kuralagam, aged 25 to 65 years. The results showed that most 38.6 of the subjects fall in the middle age group. Fifty per cent of the subject's income level is in between Rs. 5000 to Rs. 10,000. Subjects have their educational qualification up to secondary school level 30 and there are also subjects who had obtained their degree 26 . The frequency of food consumption was examined based on the major food groups which includes the cereals, pulses and legumes, milk and milk products, meat and meat products, vegetables and fruits, fats and oils, and sugar products. Rice 98 , milk 93.5 , sunflower oil 77 and sugar 91.5 are included in their diet daily whereas others foods were included in weekly or monthly basis. This study helped to under the economic status and the dietary pattern of the self help group women. K. Tryphaena Priyadharshini | D. Annette Beatrice "A Study on the General Information and Food Frequency of Self Help group Women of North Madras at Khadi Kraft and Village Industry Board, Kuralagam" Published in International Journal of Trend in Scientific Research and Development (ijtsrd), ISSN: 2456-6470, Volume-2 | Issue-5 , August 2018, URL: https://www.ijtsrd.com/papers/ijtsrd15757.pdf Paper URL: http://www.ijtsrd.com/home-science/food-science-and-quality-control/15757/a-study-on-the-general-information-and-food-frequency-of-self-help-group-women-of-north-madras-at-khadi-kraft-and-village-industry-board-kuralagam/k-tryphaena-priyadharshini<br>

E N D
International Research Research and Development (IJTSRD) International Open Access Journal International Journal of Trend in Scientific Scientific (IJTSRD) International Open Access Journal ISSN No: 2456 ISSN No: 2456 - 6470 | www.ijtsrd.com | Volume 6470 | www.ijtsrd.com | Volume - 2 | Issue – 5 A Study on the General Information and Food Frequency of Self Help A Study on the General Information and Food Frequency of Self Help A Study on the General Information and Food Frequency of Self Help group Women of North Madras at K group Women of North Madras at Khadi Kraft and Village Industry Board, Kuralagam hadi Kraft and Village Industry K. Tryphaena Priyadharshini K. Tryphaena Priyadharshini, D. Annette Beatrice* *Associate Professor Department of Home Science, Women’s Christian College, Chennai, India Department of Home Science, Women’s Christian College, Chennai, India ABSTRACT A Self-Help Group (SHG) is a voluntary association of men or women in similar economic conditions. The aim of the study is to the general information of women self-help group and to assess the dietary consumption pattern using a food frequency questionnaire. The general information of the subjects includes age, educational qualification, monthly family income, religion, marital status, family type, family size and disease condition. This study is the experimental design study. For this study, 153 women were chosen from Khadi Kraft and Village industry board, Kuralagam, aged 25 to 65 years. The results showed that most (38.6 %) of the subjects fall in the middle age group. Fifty per cent of the subject’s income level is in between Rs. 5000 to Rs. 10,000. Subjects have their educational qualification up to secondary school level (30 %) and there are also subjects who had obtained their degree (26 %). subjects who had obtained their degree (26 %). I. INTRODUCTION Self-Help Group is a development group for and marginalized. The purpose of the Self Group is to build the functional capacity of the poor and to marginalize in the field of employment and income generating activities. People are responsible for their own future by organizing themselv SHG’s [1]. Self - Help Groups are popular and famous in India and South-East Asian countries. In Bangladesh, Muhammad Yunus developed this concept for the poorest of the poor. It is an association of the poor people specially women who belong to th same social & economic background. The SHGs are usually informal groups of a locality or area, whose members have a common need and importance towards collective action. These groups normally consist of 10 to 20 members. Members of the group meet regularly, make their share of contribution Women are a vital part of the Indian Economy, both at the national and the household levels. They make one-third of the national labour force. Compared with their men folk, Indian women contribute a much larger share of their earnings to basic family maintenance with the result that women’s earnings positively and immediately affect the incidence and the security of poverty. SHGs function on the basis of co-operative principles and provide a forum for members to extent support to each other. It is considered as a means of empowerment Women are more likely to suffer from nutritional deficiencies than men are, for reasons including women's reproductive biology, low social status, women's reproductive biology, low social status, Help Group (SHG) is a voluntary association of men or women in similar economic conditions. The aim of the study is to the general information of help group and to assess the dietary consumption pattern using a food frequency e. The general information of the subjects includes age, educational qualification, monthly family income, religion, marital status, family type, family size and disease condition. This study is the experimental design study. For this study, 153 women chosen from Khadi Kraft and Village industry board, Kuralagam, aged 25 to 65 years. The results showed that most (38.6 %) of the subjects fall in the middle age group. Fifty per cent of the subject’s income level is in between Rs. 5000 to Rs. 10,000. ects have their educational qualification up to secondary school level (30 %) and there are also Help Group is a development group for the poor d. The purpose of the Self-Help Group is to build the functional capacity of the poor and to marginalize in the field of employment and income generating activities. People are responsible for their own future by organizing themselves into Help Groups are popular and East Asian countries. In Bangladesh, Muhammad Yunus developed this concept for the poorest of the poor. It is an association of the poor people specially women who belong to the same social & economic background. The SHGs are usually informal groups of a locality or area, whose members have a common need and importance towards collective action. These groups normally consist of 10 to 20 members. Members of the group ly, make their share of contribution [2]. Women are a vital part of the Indian Economy, both at the national and the household levels. They make third of the national labour force. Compared with folk, Indian women contribute a much hare of their earnings to basic family maintenance with the result that women’s earnings positively and immediately affect the incidence and the security of poverty. SHGs function on the basis of operative principles and provide a forum for xtent support to each other. It is considered as a means of empowerment [3]. The frequency of food consumption was examined based on the major food groups which includes the cereals, pulses and legumes, milk and milk products, meat and meat products, vegetables and fruits, fats and oils, and sugar products. Rice (98 %), milk (93.5 %), sunflower oil (77 %) and sugar (91.5 %) are included in their diet daily whereas others foods were included in weekly or monthly basis. This study helped to under the economic status and the dietary pattern of the self-help group women. The frequency of food consumption was examined based on the major food groups which includes the s and legumes, milk and milk products, meat and meat products, vegetables and fruits, fats and oils, and sugar products. Rice (98 %), milk (93.5 %), sunflower oil (77 %) and sugar (91.5 %) are included in their diet daily whereas others foods were in weekly or monthly basis. This study helped to under the economic status and the dietary Keywords: Consumption; Food frequency;Self group; Subjects Consumption; Food frequency;Self-help Women are more likely to suffer from nutritional deficiencies than men are, for reasons including @ IJTSRD | Available Online @ www.ijtsrd.com www.ijtsrd.com | Volume – 2 | Issue – 5 | Jul-Aug 2018 Aug 2018 Page: 33
International Journal of Trend in Scientific Research and Development (IJTSRD) ISSN: 2456-6470 poverty, and lack of education. Sociocultural traditions and disparities in household work patterns can also increase women's chances of being malnourished [4]. Women are experiencing increase in the prevalence of chronic diseases [5]. The risk of developing hypertension, heart disease, and stroke increased with severity of overweight among both women and men. Women who were overweight but not obese (i.e., BMI between 25.0 and 29.9) were also significantly more likely than their leaner peers to develop gallstones, hypertension, high cholesterol level and heart disease [6]. The major causes of poor nutritional status in women differ from those in men throughout much of adult life, with malignant neoplasms ranking highest among adult women aged 45–64 years and CVD ranking highest for men in the same age range. After the age of 64 years, however, heart disease is the leading cause of death in both men and women [7]. The relative risk for fatal coronary heart disease associated with diabetes is 50% higher in women than it is in men. Type 2 diabetes has long been known as a risk factor for coronary heart disease and is conservatively estimated to increase the risk of a fatal event by two fold. The association diabetesand coronary heart disease has been suggested to be stronger in women than in men [8]. II. MATERIALS AND METHODS The aim of the study was to collect the general information on economic status and to obtain information on the frequency of food consumption. The study population comprised of 153 self-help group of women from the Tamil Nadu Khadi Kraft and Village Industries Board, Kuralagam who are aged 25 to 65 years and above. The data was collected from each woman. It comprised of the age, educational qualification, marital status, family type, family size, income level, religion and diseases condition. Dietary intake was assessed using the food frequency questionnaire to know the consumption of various foods and their frequency. The questionnaire covered all the food groups. The frequency of consumption was recorded in terms of daily, weekly, monthly and never. A.Analysis of Data Data obtained through questionnaire were coded, classified and tabulated for further statistical analysis. The data collected were analysed using suitable statistical analysis. III. RESULTS AND DISCUSSION General Information The general information of the subjects included age, educational qualification, monthly family income, religion, marital status, family type, family size and disease condition. The age of the subjects were categorized from 25 to 65 years and above. Almost 39 per cent of the subjects belong to the age group of 45 to 55 years of age. With regard to educational qualification 30 per cent of the subjects were qualified up to secondary school level. Twenty three per cent of the subjects had studied only up to 3rd standard whereas twenty six percent of the subjects had perused their degree. Around 81.7 % of the subjects belong to the Hindu community. While the subjects from Christian (15.7 %) and Muslim (2.6 %) communities were found to be less. Many (82 %) of the subjects were married. Only 13 % of the subjects were single and 4.6 % are widow. It is found that most (68.8 %) of the families belong to the nuclear type. Joint families are found to be only 27 % and extended families are around 4.6 %.Many (73.2 %) of the subjects families are small sized; only two to four members are present in the family. A.Income level The income levels of the subjects are presented in the figure 1 below. diabetes, gallstones, between Fig. 1 Percentage Distribution of Subjects According to Family Income (monthly) @ IJTSRD | Available Online @ www.ijtsrd.com | Volume – 2 | Issue – 5 | Jul-Aug 2018 Page: 34
International Journal of Trend in Scientific Research and Development (IJTSRD) ISSN: 2456-6470 It can be seen that 55 % of the subject’s family monthly income was Rs. 5000 to Rs. 10,000. Equal percentage (21%) of the subjects earns between Rs. 1000 to Rs. 2500 and Rs. 5000 and Rs. 10,000. B.Disease Condition The percentage distribution of the subjects according to the disease condition is presented in the graph below (Figure 2) The above table 1 reveals that 98 % of the subjects consume rice on daily basis whereas wheat (67 %) is consumed on weekly basis. It can be seen that many of the subjects never included millets such as vargu (66.7 %), bajra (70 %) and jowar (54.2 %) in their diet. Table2. Percentage Distribution of Subjects According to Frequency of Consumption of Pulses and Legumes Pulses and Legumes Bengal Gram dhal Green Gram dhal Red gram dhal Black gram dhal Soya products The above table 2 shows that many of the subjects include Bengal gram dhal (78 %), green gram dhal (64.7 %), red gram dhal (75.2 %) and black gram dhal (47.1 %) on weekly basis in their diet and soya products (60 %) are never included in the diets by the subjects. Table3. Percentage Distribution of Subjects According to Frequency of Consumption of Milk and Milk Products Milk and Milk Products Daily Weekly Monthly Never No. % No. % No. % No. % 25 16 119 78 7 5 2 1 15 10 99 65 26 17 13 9 20 13 115 75 10 7 8 5 70 46 72 47 8 5 3 2 2 1 16 11 44 29 91 60 Fig. 2 Percentage Distribution of Subjects According to Disease Condition Seventy percent of the subjects did not suffer from any disease condition. But there were few subjects with hypertension (14.3 %) and diabetes (11.75 %). C.Frequency of Food Consumption The food consumption pattern of the subjects was studied and tabulated according the food groups such ascereals, pulses and legumes, milk and milk products, meat and meat products, vegetables and fruits, fats and oils, and sugar products. Table1. Percentage Distribution of Subjects According to Frequency of Consumption of Cereals Cereals Daily Weekly Monthly No. % No. % No. % No. % Rice 150 98 3 Wheat 24 16 105 69 Maida 7 4.6 22 14 Ragi 13 8.5 20 13 Jowar 8 5.2 2 Vargu 10 6.5 5 Bajra 10 6.5 5 Daily Weekly Monthly Never No. % No. % No. % No. % Never Milk 143 94 6 4 2 1 2 1 Cheese 0 0 4 3 44 29 105 69 2 0 21 92 69 60 36 31 0 14 60 45 39 24 102 67 20 107 70 0 3 32 21 51 33 83 0 2 Paneer 0 0 5 3 30 20 118 77 Curd 52 34 73 48 19 12 9 6 From the above table 3, milk was consumed daily by 93.5 per cent of the subjects drink. Curd (48 %) was consumed on weekly basis. Many of the subjects never included paneer (77 %) and cheese (69 %) in their diet. 1 3 3 54 @ IJTSRD | Available Online @ www.ijtsrd.com | Volume – 2 | Issue – 5 | Jul-Aug 2018 Page: 35
International Journal of Trend in Scientific Research and Development (IJTSRD) ISSN: 2456 in Scientific Research and Development (IJTSRD) ISSN: 2456 in Scientific Research and Development (IJTSRD) ISSN: 2456-6470 Table5. Percentage Distribution of Subjects According to Frequency of Consumption of Vegetables Vegetables No. (carrot, potato, beet root) 38 Percentage Distribution of Subjects According to Frequency of Consumption of Vegetables Percentage Distribution of Subjects According to Frequency of Consumption of Vegetables Daily Weekly No. 110 71.9 Monthly No. 5 Monthly No. Never No. % % % 3.3 0 % 0 Roots & tubers (carrot, potato, beet root) 24.8 Green leafy vegetables (spinach, drumstick leaves) Other vegetables ( beans, ladies finger, drumstick, gourd varieties) The table 5 shows that root and tubers (72 %), green leafy vegetables (71 %) and other vegetables (51.6 %) like beans, ladies finger, drumstick, and gourd varieties were consumed on weekly basis by the subjects. beans, ladies finger, drumstick, and gourd varieties were consumed on weekly basis by the subjects. Percentage Distribution of Subjects According to Frequency of Consumption of Fruits Daily Weekly No. % No. 20 13 51 4 3 28 4 3 55 3 2 20 From the table 6 it is found to be that the consumption of seasonal fruits (50 %), tropical fruits (48 %), citrus fruits (54 %) and dried fruits (44 %) were only on the weekly basis. Green leafy vegetables (spinach, drumstick 16 10.5 109 71.2 26 17 1 0.7 Other vegetables ( beans, ladies finger, 69 45.1 79 51.6 2 1.3 3 1.9 The table 5 shows that root and tubers (72 %), green leafy vegetables (71 %) and other vegetables (51.6 %) like The table 5 shows that root and tubers (72 %), green leafy vegetables (71 %) and other vegetables (51.6 %) like beans, ladies finger, drumstick, and gourd varieties were consumed on weekly basis by the subjects. Table6. Percentage Distribution of Subjects According to Frequency of Consumption of Fruits Fruits Monthly No. 77 73 82 68 Never No. % 5 48 12 62 Never % 33 18.7 36 13.1 % 50 48 54 44 % 3.3 31 7.8 Seasonal fruits Tropical fruits Citrus fruits Dried fruits 3.3 31 7.8 41 41 From the table 6 it is found to be that the consumption of seasonal fruits (50 %), tropical fruits (48 %), citrus fruits (54 %) and dried fruits (44 %) were only on the weekly basis. Table7. Percentage Distribution of Subjects Fats and Oilseeds Fats and Oilseeds Daily No. % 3 2.0 8 10 6.5 17 6 3.9 8 117 77 43 28 Corn/rice bran/ groundnut oil 40 26 5 3.3 13 The above table 7 reveals that the consumption of sunflower oil was found to be on the daily basis by many (77 subjects. Gingely oil (44 %) and corn/rice bran/groundnut oil (39 %) are included only on weekly in their diet. Butter (59 %), Ghee (47 %), dalda (78 %) and coconut oil (77 %) were never included by many of their diet. Butter (59 %), Ghee (47 %), dalda (78 %) and coconut oil (77 %) were never included by many of From the table 6 it is found to be that the consumption of seasonal fruits (50 %), tropical fruits (48 %), citrus Percentage Distribution of Subjects According to Frequency of Consumption of Fats and Oils According to Frequency of Consumption of Fats and Oils Weekly No. Monthly No. Never No. 90 72 120 78 12 24 32 Never No. 90 72 120 12 24 32 118 118 77 % 5.2 52 11 5.2 19 14 44 39 8.5 17 % 34 35 12 1 12 14 11 % 59 47 Butter Ghee Dalda Sunflower oil Gingely oil Corn/rice bran/ groundnut oil Coconut oil 54 22 67 59 2 19 22 8 16 21 The above table 7 reveals that the consumption of sunflower oil was found to be on the daily basis by many (77 subjects. Gingely oil (44 %) and corn/rice bran/groundnut oil (39 %) are included only on weekly in The above table 7 reveals that the consumption of sunflower oil was found to be on the daily basis by many (77 %) of the subjects. Gingely oil (44 %) and corn/rice bran/groundnut oil (39 %) are included only on weekly in their diet. Butter (59 %), Ghee (47 %), dalda (78 %) and coconut oil (77 %) were never included by many of the subjects in their diet. Distribution of Subjects According to Frequency of Consumption of Sugar Products Daily No. % 140 91.5 8 3 2.0 1 0.7 Table 8 shows that (91.5 %) majority of the subjects consume sugar daily and few do not consume because of health reason. Fifty one percent and 36.6 %of the subjects consume jaggery and honey on a monthly basis. They include them for dessert preparation and for toppings, while 49 % and 86 % of the subjects never d for toppings, while 49 % and 86 % of the subjects never Table8. Percentage Distribution of Subj Consumption of Sugar Products Never % 2.6 32 56.2 Sugar Products Weekly No. % No. 5.2 1 23 15 10 6.5 56 Monthly Never No. 4 49 % 0.7 51 36.6 86 Sugar Jaggery Honey 78 Table 8 shows that (91.5 %) majority of the subjects consume sugar daily and few do not consume because of health reason. Fifty one percent and 36.6 %of the subjects consume jaggery and honey on a monthly basis. They include them for dessert preparation an consumed jaggery and honey. Table 8 shows that (91.5 %) majority of the subjects consume sugar daily and few do not consume because of health reason. Fifty one percent and 36.6 %of the subjects consume jaggery and honey on a monthly basis. @ IJTSRD | Available Online @ www.ijtsrd.com @ IJTSRD | Available Online @ www.ijtsrd.com | Volume – 2 | Issue – 5 | Jul-Aug 2018 Aug 2018 Page: 36
International Journal of Trend in Scientific Research and Development (IJTSRD) ISSN: 2456 in Scientific Research and Development (IJTSRD) ISSN: 2456 in Scientific Research and Development (IJTSRD) ISSN: 2456-6470 Home Science, Women’s Christian College for with the generous grand. Home Science, Women’s Christian College for supporting the study with the generous grand. REFERENCES 1.Marg, S. (2008). A Report on the Success and Failure of SHG’s in India Paradigm of success. Voluntary Operation in Community & Environment. New Delhi. Community & Environment. New Delhi. IV. DISCUSSION The study shows that the women mostly belong to the lower middle class income level. It is also found that most of the subjects have finished their secondary school and many of the subjects have finished their degree. Nowadays many women are involved in perusing higher education to stand on their own. These women in Self Help group are working hard to become great entrepreneurs. Many of the members in the group fall between the middle age (45 categories. Younger generation are also taking part in Self-help groups to improve their skills and to support their family. While coming to their frequency of consumption of foods, we can see that the consumption of the major food groups was found only on the weekly or monthly basis except for rice, milk, sunflower oil and sugar which was included daily in their diet. It is important to take fruits and vegetables in their daily routine, which is important to lead a healthy life. V. CONCLUSION The self-help group is found to be the fast emerging groups especially for women. The general information of the subjects helped us to know the economic status of each woman and also their disease condition. From the general observation of frequency of food, it can be seen that there is an unhealthy eating pattern among the subjects. Since the vegetables and fruits and even other major food groups are consumed in weekly or monthly basis, the subjects may lack in nutrition. Awareness on healthy eating habits and nutrition should be given to the subjects in improving their lifestyle. ACKNOWLEDGEMENT We thank Dr. Ponnuraja, Senior Scientist, ICMR, Chennai for helping with statistical analysis of the data. We thank the Centre for Nutrition Counselling Research and Extension Activities, Department of The study shows that the women mostly belong to the lower middle class income level. It is also found that have finished their secondary school and many of the subjects have finished their degree. Nowadays many women are involved in perusing higher education to stand on their own. These women in Self Help group are working hard to Marg, S. (2008). A Report on the Success and Failure of SHG’s in India –Impediments and Paradigm of success. Voluntary Operation in any of the members in 2.Anand, P. (2013). What are Self Help groups (SHGs) in India? – Objectives & Features of SHGs. Priyanka Blog Thoughts. SHGs. Priyanka Blog Thoughts. Anand, P. (2013). What are Self Help groups Objectives & Features of the group fall between the middle age (45 – 55 years) categories. Younger generation are also taking part in help groups to improve their skills and to support their family. While coming to their frequency of , we can see that the consumption of the major food groups was found only on the weekly or monthly basis except for rice, milk, sunflower oil and sugar which was included daily in their diet. It is important to take fruits and vegetables tine, which is important to lead a 3.Misra, N. (2013). Self-Help Group (SHG) of India: Meaning, Need and Objectives. Your Article http://www.yourarticlelibrary.com/india help-group/self-help-group need-and-objectives/66718. objectives/66718. Help Group (SHG) of India: Meaning, Need and Objectives. Your Library. http://www.yourarticlelibrary.com/india-2/self- group-shg-of-india-meaning- 4.Galloway, R. (2002). Women's Perceptions of Iron Deficiency and Anaemia Prevention and Control in Eight Developing Countries. Science & Medicine. 55(4):529 . 55(4):529-44 Galloway, R. (2002). Women's Perceptions of Iron Deficiency and Anaemia Prevention and Control in Eight Developing Countries. Social help group is found to be the fast emerging groups especially for women. The general information of the subjects helped us to know the economic status 5.Barfield. (2012). Preventing Chronic Disease in Women of Reproductive Age: Opportunities for Health Promotion and Preventive Services. Preventive Chronic Disease. Preventive Chronic Disease. 9: E34. Barfield. (2012). Preventing Chronic Disease in of Reproductive Age: Opportunities for Health Promotion and Preventive Services. ease condition. From 6.Field, A. E. (2001). Impact of Overweight on the Risk of Developing Common Chronic Diseases during a 10-Year Period. medicine American Association. 161(13):1581 161(13):1581-6. Field, A. E. (2001). Impact of Overweight on the Risk of Developing Common Chronic Diseases Year Period. Archives of internal edicine American the general observation of frequency of food, it can be seen that there is an unhealthy eating pattern among the subjects. Since the vegetables and fruits and even other major food groups are consumed in weekly or subjects may lack in nutrition. Awareness on healthy eating habits and nutrition should be given to the subjects in improving their Medical Medical 7.Willett, W. C. (2000). Adherence to the Dietary Guidelines for Americans and risk of major chronic disease in women. of Clinical Nutrition. 72(5):1214 72(5):1214–1222. Willett, W. C. (2000). Adherence to the Dietary Guidelines for Americans and risk of major chronic disease in women. The American Journal 8.Huxley, R. (2006). Excess risk of fatal coronary heart disease associated with diabetes in men and women: meta-analysis of 37 prospective cohort studies. British Medical Publishing. 14(332):73–78 Excess risk of fatal coronary Ponnuraja, Senior Scientist, ICMR, Chennai for helping with statistical analysis of the heart disease associated with diabetes in men and analysis of 37 prospective cohort British Medical 78. Journal Journal (BMJ) (BMJ) We thank the Centre for Nutrition Counselling Research and Extension Activities, Department of @ IJTSRD | Available Online @ www.ijtsrd.com @ IJTSRD | Available Online @ www.ijtsrd.com | Volume – 2 | Issue – 5 | Jul-Aug 2018 Aug 2018 Page: 37