Download

1 / 12
130 likes | 153 Views
Agriculture and food industry are the backbone of any country. Food industry is the prime contributor in agricultural sector. Thus, automation of vegetable grading and sorting is the need of the hour. Since, artificial neural networks are best suited for automated pattern recognition problems; they are used as a classification tool for this research. Back propagation is the most important algorithm for training neural networks. But, it easily gets trapped in local minima leading to inaccurate solutions.

E N D
March 2022 10 III https://doi.org/10.22214/ijraset.2022.40407
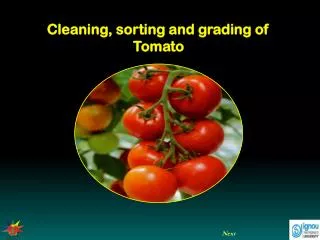
International Journal for Research in Applied Science & Engineering Technology (IJRASET) ISSN: 2321-9653; IC Value: 45.98; SJ Impact Factor: 7.538 Volume 10 Issue III Mar 2022- Available at www.ijraset.com Vegetable Grading and Sorting using Artificial Intelligence Omer Farooq1, Jasmeen Gill2 1Research Scholar, RIMT University, Mandi Gobindgarh, Punjab, India 2Department of Research Innovation and Incubation, RIMT University, Mandi Gobindgarh, Punjab, India Abstract: Agriculture and food industry are the backbone of any country. Food industry is the prime contributor in agricultural sector. Thus, automation of vegetable grading and sorting is the need of the hour. Since, artificial neural networks are best suited for automated pattern recognition problems; they are used as a classification tool for this research. Back propagation is the most important algorithm for training neural networks. But, it easily gets trapped in local minima leading to inaccurate solutions. Therefore, some global search and optimization techniques were required to hybridize with artificial neural networks. One such technique is Genetic algorithms that imitate the principle of natural evolution. So, in this article, a hybrid intelligent system is proposed for vegetable grading and sorting in which artificial neural networks are merged with genetic algorithms. Results show that proposed hybrid model outperformed the existing back propagation based system. Keywords: Vegetable grading and sorting; artificial neural networks; Particle Swarm Optimization; Hybrid intelligent system; Pattern recognition I. INTRODUCTION Since ages, nature has served the mankind in plentiful ways. Agriculture is the ultimate example of that and even today, agriculture industry contributes a major part in any nation’s growth. India which is an agricultural land has gained an eminent economical status across the globe. As per the 2014 FAO world agriculture statistics, India is the world's largest producer of many fresh fruits and vegetables [wiki10]. The total horticulture produce reached 277.4 million metric tons in 2013, making India the second largest producer of horticultural products after China [55]. Of this, India in 2013 produced 81 million tons of fruits, 162 million tons of vegetables, 5.7 million tons of spices, 17 million tons of nuts and plantation products (cashew, cacao, coconut, etc.), 1 million tons of aromatic horticulture produce and 1.7 million tons of flowers (7.6 billion cut flowers) [56], [57]. However, the actual share in the world fruit and vegetable market is considerably low and the figures are indeed disappointing when the country’s profits from agriculture sector are contrasted with the produce. In such a scenario, automation can reduce the costs by promoting production efficiency. And, automation of vegetable grading and sorting plays a significant role in augmenting the value of produces. Moreover, it adds to the benefit of reducing subjectivity arising from human experts. Therefore, automated grading and sorting of vegetables helps in raising the economical gains to a large extent, as such have fascinated many researchers in the field to carry out their extensive research. This motivated the present research work which is based on automated vegetable grading and sorting using efficient artificial intelligent techniques. The remaining article is organized as follows: a brief literature survey is provided in Section 2, details of proposed model and methodology are given in Section 3, results and discussions are presented in Section 4, and the conclusions are summarized in Section 5. II. LITERATURE REVIEW Fruit grading and sorting was performed for variety of fruits such as apple, banana, watermelon, pomegranate, date, chili, grapes, blueberry, peach and many more. In the field of artificial neural networks, a number of contributions could be found. Bennedsen et al. (2007) detected surface defects for apple fruit in near infrared images utilizing artificial neural networks with principal component analysis. An accuracy rate of 79% was achieved. Likewise, Unay and Gosselin (2005) developed a neural networks based defect detection-cum-grading system for apple fruit. The system achieved 89.9 % accuracy in classifying the defects. Another effort was done by Cetişli and Büyükçingir (2013) who proposed a novel model to predict the early appearance of apple scab based on neuro-fuzzy classifier. 13 ©IJRASET: All Rights are Reserved | SJ Impact Factor 7.538 | ISRA Journal Impact Factor 7.894 |
International Journal for Research in Applied Science & Engineering Technology (IJRASET) ISSN: 2321-9653; IC Value: 45.98; SJ Impact Factor: 7.538 Volume 10 Issue III Mar 2022- Available at www.ijraset.com Ohali (2011) developed grading model using back propagation neural networks as classification tool. The main cultivar was date fruit. Similarly, Khalid and Tamer (2012) employed two variants of neural networks: back propagation algorithm and radial basis function to classify date fruit varieties. Janik et al. (2007) compared the performance of partial least squares (PLS) regression analysis and ANN for grapes in visible-near-infrared spectra. Another attempt to compare the performance of ANN was by Motaveli et al. (2010). The authors compared different mathematical models with ANN for predicting the drying of pomegranate. It was established that ANN performed well as compared to respite mathematical models under study. Yet another classification model was proposed by Llobet et al. (1999) to predict the ripeness of bananas using electronic nose sensors. Three different classifiers (Fuzzy ARTMAP, LVQ and ANN) were compared. While working for orange fruit, Rasekhi and Raoufat (2011) evaluated the performance of three ANN models: variable learning rate back propagation (MLP-GDM), resilient back propagation (MLP-RP) and scaled conjugate gradient (MLP-SCG). MLP-RP and MLP-SCG models outperformed the simple gradient back propagation algorithm. In a similar attempt, Mercol et al. (2007) performed orange fruit classification using five decision trees (J48, Classification and Regression Tree (CART), Best First Tree, Logistic Model Tree (LMT) and Random Forest), two neural network models (BPA, RBF) and Support Vector Machines. Salim et al. developed a non-destructive mango fruit ripeness prediction model using gas sensors. ANN was effectively trained to classify mangoes according to different ripeness stages. One more contribution was by Zakaria et al. (2012) to evaluate the maturity of mangoes. Here Linear Discriminant Analysis (LDA) was hybridized with ANN to discriminate the mango harvested at week 7 and week 8. A handful of contributions were made in the field of vegetable grading using artificial neural networks. However, little emphasis was given to improve the classification accuracy of the models. Perhaps, this could be a possible reason for availability of very few contributions related to optimization of classifiers. So, the present research tries to achieve two objectives: one is to hybridize ANN with GA to eliminate the merits of BPA; and the other is to implement the hybrid model for accurate vegetable grading and sorting model. III. MATERIALS AND METHODS The vegetable grading model mainly works in five phases: Image acquisition, pre-processing, segmentation, feature extraction and classification, as shown in figure 1. FEATURE EXTRACTION VEGETABLE CLASSIFICATION PRE- IMAGE IMAGE ACQUISITION PROCESSING SEGMENTATION GRAD E: Class A OUTPUT Figure 1: Block Diagram of Vegetable Grading Model A. Image Acquisition The model initiated with the image acquisition task. Vegetable is chosen as a sample for the model. Own camera set-up was used to acquire the images. B. Pre-processing The next task after image acquisition was the resizing and cropping of images to a fixed size. All the images were resized to same dimensions of 100×100. Then the images were enhanced using Wiener filter. The reason for using Wiener filter was that it adjusts itself according to the local intensity variance in the image. The filter performed less smoothing for regions of large intensity variance and more smoothing for regions of small variance values. Therefore, the filter was very well suited for vegetable grading applications where vegetable edges were to be retained while small bruises on the surface were to be smoothed off. 14 ©IJRASET: All Rights are Reserved | SJ Impact Factor 7.538 | ISRA Journal Impact Factor 7.894 |
International Journal for Research in Applied Science & Engineering Technology (IJRASET) ISSN: 2321-9653; IC Value: 45.98; SJ Impact Factor: 7.538 Volume 10 Issue III Mar 2022- Available at www.ijraset.com C. Segmentation In the proposed model, segmentation was the third and most important task. Otsu threshold-based method (Otsu, 1979) was used for separating the vegetable object from the rest of the image. The steps of the algorithm are given in figure 2. 1. Compute histogram and probabilities of each intensity level. 2. Set up initial class probability ωi(0) and class mean μi(0). 3. Step through all possible thresholds t=1…maximum intensity: 1. 3.2. Compute intra-class variance o2 (t) 4. Desired threshold corresponds to the maximum o2 (t). 5. Compute two maxima (and two corresponding thresholds). o2 (t) is the greater max and o2 (t) is the greater or equal to b1 b2 maximum. 6. Compute Desired threshold =threshold1+threshold2. Update ωi and μi. b b 2 Figure 2: Steps of Otsu Segmentation D. Feature Extraction As discussed earlier, Otsu segmentation was performed to obtain the object of interest from the image. Thereafter, feature extraction was performed, in which, two different set of features were extracted, namely, color based and shape based. Six color based features were obtained: mean of R, G and B components and standard deviation of R, G and B components of colored image. Six shape based features were extracted: Area, major axis, minor axis, eccentricity, perimeter-O, and perimeter-S. Two perimeter values were taken. Perimeter-O denotes perimeter value of object of interest obtained after Otsu segmentation and Perimeter-S denotes perimeter value of vegetable as well as defect (if any) on the vegetable surface. To compute perimeter-S, some edge detection technique was to be employed. In the proposed system, Sobel edge detection (Sobel, 1970) operator was used. The basic idea behind perimeter compute was to grade the vegetable according to its color, shape and defect. Color and shape were directly obtained from features, but, defect was indirectly obtained by comparing the Otsu perimeter and Sobel perimeter. If there is difference in perimeter values, the defect is present else the vegetable is non-defective. The details of features are provided in table 1. Table 1: Details of Features Extracted for Vegetable Grading Applications Feature Description Mean_R Mean of ‘R’ component Mean_G Mean of ‘G’ component Mean_B Mean of ‘B’ component Std_R Standard deviation of ‘R’ component Std_G Standard deviation of ‘G’ component Std_B Standard deviation of ‘B’ component Number of pixels in the region described by the shape Largest distance connecting one point to another on the region boundary, going through the center of the region. Smallest distance connecting one point to another on the region boundary, going through the center of the region. Type Formula M ∑N x ∑ i M. N j µ = 1. Color based features n 1 Σ ( xi − X¯)2 n − 1 i SD = J Area = Σ I(x, y) Area s,y Major axis --- Minor axis --- 2. Shape based features najor axis ninor axis Ecc = Eccentricity Measure of aspect ratio Distance around the boundary of object, calculated from Otsu segmented image. It consisted vegetable boundary only. Distance around the boundary of object, calculated from Sobel segmented image. It included defect as well as vegetable boundary Perineter = Σ | xi − xi+1 | Perimeter-O s,y Perineter = Σ | xi − xi+1 | Perimeter-S s,y 15 ©IJRASET: All Rights are Reserved | SJ Impact Factor 7.538 | ISRA Journal Impact Factor 7.894 |
International Journal for Research in Applied Science & Engineering Technology (IJRASET) ISSN: 2321-9653; IC Value: 45.98; SJ Impact Factor: 7.538 Volume 10 Issue III Mar 2022- Available at www.ijraset.com E. Classification Classification was the final step. It was performed using the hybrid genetic algorithm based back propagation approach. The block diagram of the classification algorithm is shown in figure 3. Error Calculation Fitness Evaluation New Testing (Solution) Population Generation Weight Extraction Population Selection Crossover Mutation Figure 3: The block diagram of GA/BP based Hybrid Classifier In genetic algorithm domain, a specific terminology based on natural genetics is followed (Goldberg, 2008). The word ‘chromosome’ is used to represent the alternative solution for the problem. In present problem, features extracted from vegetable images act as ‘genes’ and set of such genes form the chromosomes. Set of chromosomes further form the ‘population’ of alternative solutions. The term ‘weight’ signifies the importance assigned to inputs, fed to the network. ‘Error’ means difference in the forecasted and desired outputs. ‘Fitness’ is how close an individual (alternative solution) to the desired solution. More the fitness of the individual, more suitable candidate it is for the solution. Fitness is always inversely proportional to the error value. ‘Selection’ operator indicates finding the two fittest individuals out of population of alternatives. ‘Crossover’ operator implies merging of two parents (fittest alternatives) to reproduce a new offspring (new candidate solution). ‘Mutation’ operator means inculcating fresh features in the offspring to get diversity in the newly generated population. The GA/BP NN algorithm works as follows: 1) Step 1: Generate random population of ‘p’ chromosomes (suitable solutions for the problem). 2) Step 2: Extract weights for input-hidden-output (l-m-n) layers from each chromosome x. 3) Step 3: Evaluate the fitness f(x) of each chromosome x in the population by reciprocating the cumulative error values obtained for each input set (weather forecasting data). 4) Step4: Create a new population by repeating following steps until the new population is complete a) Selection: Select two parent chromosomes from a population according to their fitness (the better fitness, the bigger chance to be selected) b) Crossover: Cross over the parents to form new offspring (children). If no crossover was performed, offspring is the exact copy of parents. c) Mutation: With a mutation probability mutate new offspring at each position in chromosome. d) Acceptance: Place the new offspring in the new population. 5) Step 5: Repeat steps 3 to 5 until stopping condition is met. The output of classification step was in the form of text that specifies the class to which the vegetable belonged to. Based on these classes, further grading was performed. The grading rules were: Assigning class A to non-defective vegetable, class B to vegetable having nominal surface defects and Class C to defective vegetable. Hence, vegetable grading was performed based on these rules. IV. RESULTS AND DISCUSSION An l-m-n architecture of 12-6-1 was used for simulation of neural networks as depicted in figure 4. The count of input neurons depends upon the number of feature extracted from the image, while the count of output neurons depend on the output values to be forecasted. For this scenario, the number of input neurons was 12 as the features extracted were 12 in count. Since, the network had shown minimum error values when number of hidden neurons were 6, so, m=6. Finally, the number of output neurons was taken as 1, because, there were three grading classes (Class A, Class B and Class C) and one of the three will be forecasted as output class. 16 ©IJRASET: All Rights are Reserved | SJ Impact Factor 7.538 | ISRA Journal Impact Factor 7.894 |
International Journal for Research in Applied Science & Engineering Technology (IJRASET) ISSN: 2321-9653; IC Value: 45.98; SJ Impact Factor: 7.538 Volume 10 Issue III Mar 2022- Available at www.ijraset.com I1 I2 O1 I12 INPUT LAYER l = 12 HIDDEN LAYER m = 6 OUTPUT LAYER n = 1 NEURON WEIGHT Figure 4: Neural Network Architecture for Fruit Grading Model The GA/BP vegetable model worked in two fractions: Training and Testing. In the training phase, the 12-6-1 network was trained for inputs as well as outputs (supervised learning) to obtain weights. These weights along with different input values were then fed to the network for testing. In this study, inputs were vegetable images and outputs were grade classes: Grade A-C. From the total 50 images, 35 were used for training purposes while 15 images for testing. A summary of various techniques applied at each step of the vegetable grading model are provided in table 2. Outputs of three samples corresponding to five phases are depicted in the last three columns of the table. While analyzing the outputs, the images acquired from natural scene are converted to gray scale images and then enhanced by Wiener filter in pre-processing phase. Afterwards background is separated to obtain the vegetable object from images using Otsu threshold based method. The output is binary images. Otsu segmentation is well suited for background subtraction purposes. However, it did not provide sufficient information regarding the vegetable defects as it is visible in the table too. Consequently, another segmentation technique: Sobel edge operator was applied. Then, the color and shape based features were obtained in the feature extraction phase. Here, color based features assisted in classifying raw or ripe vegetables so that the network could be trained to classify them. These were obtained directly from the RGB images. Shape based features were used to grade vegetables according to size and defects. Area, major axis, minor axis and eccentricity, all depicted the size of vegetables and were computed using the Otsu segmented image. Perimeter feature was utilized to extract the defect related information. It was computed both from Otsu segmented image (perimeter- O) and Sobel operator image (perimeter-S). The vegetable samples having surface defects had more difference in perimeter values, while, those with no defects were quite close. Using these features, the GA/BP NN was trained in the classification phase for 35 different images. After training, weights were extracted, which were fed along with new 15 images so as to grade them according to the rule discussed earlier. In the table, sample 1 was graded as Class A because the vegetable had no surface defects and it is ripe. Sample 2 was classified as Class B, though it contained no surface defects but it was unripe (raw). The color based feature values depict the difference with the other two samples. Sample 3 was graded as Class C, since, it had surface defects. On comparing the perimeter-O and Primeter-S values for all the samples, it was obvious to put the sample 3 in Class C. 17 ©IJRASET: All Rights are Reserved | SJ Impact Factor 7.538 | ISRA Journal Impact Factor 7.894 |
International Journal for Research in Applied Science & Engineering Technology (IJRASET) ISSN: 2321-9653; IC Value: 45.98; SJ Impact Factor: 7.538 Volume 10 Issue III Mar 2022- Available at www.ijraset.com Table 2: Step-wise Outputs for Vegetable Grading Model Technique Applied Sample 1 Output of Phase Sample 2 Sr. no. Phase Sample 3 Image Acquisition Own Camera Setup 1. Pre- 2. processing Wiener Filter Otsu Threshold based method 3. Segmentation Sobel Edge Detection method Color based Features 213.5776 210.4785 158.4328 24.5176 34.3755 97.2350 Shape based Features 7917 118.6926 85.7838 0.6911 357.4630 347.8061 Mean_R Mean_G Mean_B Std_R Std_G Std_B 188.2220 212.7427 207.7930 50.8604 41.9398 75.0643 207.8598 211.0254 170.1105 29.2215 37.9538 89.0373 Feature Extraction 4. Area 3698 118.6904 39.9413 0.9417 274.5097 275.9239 7739 124.6422 79.2224 0.7720 342.4924 411.8478 Major axis Minor axis Eccentricity Perimeter-O Perimeter-S GA/BP Neural Networks 5. Classification GRADE: Class A GRADE: Class B GRADE: Class C 18 ©IJRASET: All Rights are Reserved | SJ Impact Factor 7.538 | ISRA Journal Impact Factor 7.894 |
International Journal for Research in Applied Science & Engineering Technology (IJRASET) ISSN: 2321-9653; IC Value: 45.98; SJ Impact Factor: 7.538 Volume 10 Issue III Mar 2022- Available at www.ijraset.com The error versus iteration graph for back propagation neural networks (BPNN) and GA/BP neural networks is shown in figure 5 and 6, respectively. It is quite evident from the graph that GA/BP NN converged to solution earlier than BPNN. It took less than 190 iterations for GA/BP to converge while BPNN took more than 200 iterations for the same. Probable reason for late convergence of BPNN might be that it got trapped into local minima. This further led to slow training. The constant line after 80th iteration, in figure 5, undoubtedly supported the fact that BPNN suffers from local minima problem. Also, it is evident from figure 6 that GA/BP had eliminated this problem for vegetable grading model. Plot of error vs. iterations 45 40 error vs. iterations 35 Cumulative Error--> 30 25 20 15 10 5 0 20 40 60 80 100 120 140 160 180 200 Iterations--> Figure 5: Error vs. Iteration graph for BPNN Approach Plot of error vs. iterations 250 error vs. iterations 200 Cumulative Error--> 150 100 50 0 150 0 50 100 200 250 300 Iterations--> Figure 6: Error vs. Iteration graph for GA/BP NN Approach In order to compare the proposed GA/BP NN based vegetable grading model with BPNN models, a quantitative analysis was performed. Confusion matrices for both the models were formed after the testing phase. As discussed earlier, 15 vegetable images were taken for testing. The test set was so designed to include 5 images for every grading class. This employs 5 images of Grade A, 5 images of Grade B and 5 images of Grade C. From the confusion matrices of figure 7(a) and (b), classification parameters were computed for both the models, provided in table 3. Two types of parameters were considered: one to determine the overall performance and other to evaluate grading class-wise performance. The former type included accuracy and misclassification rate while the latter were true positive rate, false Positive rate, specificity, precision, and prevalence. 19 ©IJRASET: All Rights are Reserved | SJ Impact Factor 7.538 | ISRA Journal Impact Factor 7.894 |
International Journal for Research in Applied Science & Engineering Technology (IJRASET) ISSN: 2321-9653; IC Value: 45.98; SJ Impact Factor: 7.538 Volume 10 Issue III Mar 2022- Available at www.ijraset.com Predicted Output Grade A 4 1 0 Predicted Output Grade A 5 0 0 Grading Class Grading Class Grade B 1 3 1 Grade C 0 1 4 Grade B 0 4 0 Grade C Grade A Grade B Grade C Grade A Grade B Grade C 0 1 5 Actual Output Actual Output (a) Confusion matrix for BPNN (b) Confusion matrix for GA/BP NN Figure 7: Confusion Matrix for Accuracy Evaluation- BPNN vs. GA/BP NN Table 3: Performance Evaluation of BPNN and GA/BP NN Vegetable Grading Models Formulas Output value for BPNN true eositive + true negative total cases 2. Misclassification rate total cases Parameter Output for GA/BP NN 73.33% 93.33% 1. Accuracy false eositive + false negative 26.67% 6.67% Grade A Grade B Grade C Grade A Grade B Grade C true eositives actual eositive cases 3. True Positive rate 80.0% 60.0% 80.0% 100% 80.0% 100% false eositives actual negative cases true negatives actual negative cases 4. False Positive rate 10.0% 20.0% 10.0% 0.0% 10.0% 0% 5. Specificity 70.0% 80.0% 70.0% 90.0% 100% 90.0% true eositives forecasted eositive cases 6. Precision 36.4% 27.3% 36.4% 35.7% 28.6% 35.7% actual eositives total cases 7. Prevalence 33.3% 33.3% 33.3% 33.3% 33.3% 33.3% On analyzing the tabular values, it was manifested that GA/BP NN outperformed BPNN, showing an overall accuracy rate of 93.33%. Moreover, the misclassification rate was quite low for GA/BP NN (6.67%) as compared to BPNN (26.67%). Grading class-wise parameters also showed better results for GA/BP NN than BPNN alone. V. CONCLUSIONS Automation of vegetable grading is quite significant for increased shelf life of vegetable, maintenance of vegetable quality and less human involvement. In this article, an accurate vegetable grading system was presented in which artificial neural networks were hybridized with genetic algorithms so as to eliminate the drawbacks of back propagation algorithm. A five step procedure was followed for grading: image acquisition, pre-processing, segmentation, feature extraction and classification. The vegetable were assigned grading classes (Class A, B and C) automatically according to grading rules. The model has shown remarkable performance when compared with the existing back propagation neural networks. It has achieved an accuracy rate of 93.3% in contrast to BPNN with only 73.3% accuracy. Thus, the GA/BP NN vegetable grading model is proposed for future perspectives. REFERENCES 1 Bennedsen, B.S., Peterson, D.L. and Tabb, A., “Identifying Apple Surface Defects using Principal Components Analysis and Artificial Neural Networks”, Transactions of American Society of Agricultural and Biological Engineers, vol. 50, no. 6, pp. 2257-2265, 2007. Cetişli, B. and Büyükçingir, E.,“Time Series Prediction of Apple Scab using Meteorological Measurements”, Academic Journals: African Journal of Biotechnology, vol. 12, no. 35, pp. 5444-5451,2013. Goldberg, D. E., “Genetic Algorithms in Search, Optimization and Machine learning”, ed. 3rd, Dorling Kindersley Pvt. Ltd. with Pearson Education Inc., pp. 120- 125, 2008. 2 3 20 ©IJRASET: All Rights are Reserved | SJ Impact Factor 7.538 | ISRA Journal Impact Factor 7.894 |
International Journal for Research in Applied Science & Engineering Technology (IJRASET) ISSN: 2321-9653; IC Value: 45.98; SJ Impact Factor: 7.538 Volume 10 Issue III Mar 2022- Available at www.ijraset.com 4 5 Holland, J. H., “Adaptation in Natural and Artificial Systems”, published by University of Michigan Press, Ann Arbor, MA, 1975. Janik, L.J., Cozzolino, D., Dambergs, R., Cynkar, W. and Gishen, M., “The prediction of total anthocyanin concentration in red-grape homogenates using visible- near-infrared spectroscopy and artificial neural networks”, Analytica Chimica Acta, vol. 594, no. 1, pp. 107–118, 2007. Khalid, M.A. and Tamer, A.A.A., “Date Fruits Classification using MLP and RBF Neural Networks”, International Journal of Computer Applications, vol. 41, no. 10, pp. 36-41, 2012. Llobet, E., Hines, E.L., Gardner, J.W. and Franco, S., “Non-Destructive Banana Ripeness Determination using a Neural Network-based Electronic Nose”. Measurement Science and Technology, vol.10, no.6, pp.538–548, 1999. Mercol, J. P., Gambini, J. and Santos, J.M., “Automatic Classification of Oranges using Image Processing and Data Mining Techniques”, 2007. Motevali, A., Minaei, S., Khoshtaghaza, M.H., Kazemi, M. and Nikbakht, A. M.” Drying of Pomegranate Arils: Comparison of Predictions from Mathematical Models and Neural Networks”. International Journal of Food Engineering, issue.6, vol. 3, pp.1-20, 2010. Ohali, Y. A., “Computer Vision based Date Fruit Grading System: Design and Implementation”, Journal of King Saud University – Computer and Information Science, vol. 23, pp. 29–36, 2011. Otsu, N., “A Threshold Selection Method from Gray-Level Histograms”, IEEE transactions on Systems, Man, and Cybernetics, vol. 9, no. 1, pp. 62-66, 1979. Rajasekaran S and Vijayalakshmi P., “Neural Networks, Fuzzy Logic and Genetic Algorithms”, Prentice Hall of India, New Delhi, pp. 253-265, 2004. Rasekhi, R. and Raoufat, M. H., “Sorting Orange Fruit by Machine Vision And Neural Networks Techniques”, CIOSTA CIGR V Conference, 2011. Salim, S. N. M., Shakaff, A.Y. M., Ahmad, M.N. and Adom, A.H., “A Feasibility Study of using an Electronic Nose as a Fruit Ripeness Measuring Instrument”, 1st International Workshop on Artificial Life and Robotics, pp. 7 – 11. Sobel, I.E., “Camera Models and Machine Perception”, Ph.D. Dissertation, Stanford University, Palo Alto, Calif, 1970. Unay, D. and Gosselin, B., “Artificial Neural Network based Segmentation and Apple Grading by Machine Vision”, IEEE, 2005. Zakaria, A. et al., “Improved Maturity and Ripeness Classifications of Mangifera Indica cv. Harumanis Mangoes through Sensor Fusion of an Electronic Nose and Acoustic Sensor”, Sensors 2012, vol. 12, pp. 6023-6048, 2012. 6 7 8 9 10 11 12 13 14 15 16 17 21 ©IJRASET: All Rights are Reserved | SJ Impact Factor 7.538 | ISRA Journal Impact Factor 7.894 |
Contact Name Ijraset 16, 1st Floor, Batra Plaza, Geeta Bhawan Chownk, Sonipat, Haryana India- 131001 Address Phone 8813907089 Follow Us /ijraset /ijraset editor.ijraset@gmail.com https://www.ijraset.com /ijraset 23