Singular Value Decomposition, and Application to Recommender Systems
640 likes | 656 Views
Explore how Singular Value Decomposition is applied in recommendation systems, with a focus on Netflix and Amazon versions. Learn about the Netflix Prize competition, modeling ratings, and the importance of user preferences in making accurate predictions.

Singular Value Decomposition, and Application to Recommender Systems
E N D
Presentation Transcript
Singular Value Decomposition, and Application to Recommender Systems CSE 4309 – Machine Learning Vassilis Athitsos Computer Science and Engineering Department University of Texas at Arlington
Recommendation Systems –Netflix Version • Netflix users watch movies, and can rate each movie with an integer from 1 to 5. • Netflix tries to recommend movies to users. • To produce recommendations for a user , one could follow a process like this: • For every movie available on Netflix (except movies that user has already watched), predict (i.e., guess) the rating that user would give to movie . • This guess is based on ratings that user has provided in the past. • Recommend to user the movies for which the predicted rating is the highest.
The Netflix Prize • Back in 2006, Netflix announced a $1 million prize for the first team to produce a recommendation algorithm whose accuracy exceeded a certain threshold. • To help researchers, Netflix made available a large training set from its user data: • 470,189 users. • 17,770 movies. • About 100 million ratings. • The prize was finally claimed in 2009.
Recommendation Systems –Amazon Version • Amazon users buy products, and occasionally rate those products. • Amazon tries to recommend products to users. • To produce recommendations for a user , one could follow a process like this: • For every product available on Amazon (except products that user has already purchased), predict (i.e., guess) the rating that user would give to product . • This guess is based on ratings that user has provided in the past. • Recommend to user the products for which the predicted rating is the highest.
Recommendation Systems –Amazon Version 2 (No Ratings) • Amazon users buy products. • Amazon tries to recommend products to users. • To produce recommendations for a user , one could follow a process like this: • For every product available on Amazon (except products that user has already purchased), predict (i.e., guess) a score of how much user would want to buy product . • This guess is based on products that user has bought in the past. • Recommend to user the products for which the predicted score is the highest.
A Disclaimer • There are many different ways in which these recommendation problems can be defined and solved. • Our goal in this class is to understand some basic methods. • The way that actual companies define and solve these problems is usually more complicated.
Modeling Ratings • We want a function that predicts the rating that a user would give to a product. • Our training data can be represented as a matrix , where: • Every row corresponds to a user. • Every column corresponds to a product. • Value at row and column contains the rating that user has given to product , if user has actually rated product . • If has not rated , value is a missing value. • In other words, somehow we must tell the system that there is no valid value at row and column .
Modeling Ratings –An Example • Value at row and column contains the rating that user has given to product . • Here is a simple case, with users and movies. • The value is 1 if the user has watched the movie, 0 otherwise. • There are no missing values. • Goal: train a system to recommend movies to the user. Movie 1 Movie 2 Movie 3 Movie 4 Movie 5 Movie 6 Movie 7 Movie 8 Movie 9 User 7 User 1 User 2 User 3 User 4 User 5 User 6
Modeling Ratings –An Example • How can we make any predictions? • If a user has not watched a movie, how can we estimate how much the user would be interested? Movie 1 Movie 2 Movie 3 Movie 4 Movie 5 Movie 6 Movie 7 Movie 8 Movie 9 User 7 User 1 User 2 User 3 User 4 User 5 User 6
Modeling Ratings –An Example • Each user prefers specific movies with specific characteristics. • Each movie has certain characteristics. • If we knew what characteristics each user likes, and what characteristics each movie has, we would have enough information to make predictions. • However, we know neither what each user likes, nor what the characteristics of the movies are. Movie 1 Movie 2 Movie 3 Movie 4 Movie 5 Movie 6 Movie 7 Movie 8 Movie 9 User 7 User 1 User 2 User 3 User 4 User 5 User 6
Modeling Ratings –An Example • There is another source of information. • Some users have similar preferences. • For example, User 2 and User 7 agree on 8 of the nine values. • Intuitively, some users like similar things in movies. We may not know what the users like, but we can tell they like similar things. Movie 1 Movie 2 Movie 3 Movie 4 Movie 5 Movie 6 Movie 7 Movie 8 Movie 9 User 7 User 1 User 2 User 3 User 4 User 5 User 6
Modeling Ratings –An Example • Similarly, some movies have similar scores. • For example, Movie 1 and Movie 5 agree in six of their seven scores. • So, some movies have things in common. We may not know what those things are, but we can tell that there are similarities. Movie 1 Movie 2 Movie 3 Movie 4 Movie 5 Movie 6 Movie 7 Movie 8 Movie 9 User 7 User 1 User 2 User 3 User 4 User 5 User 6
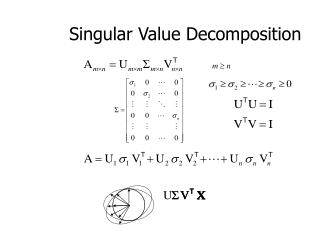
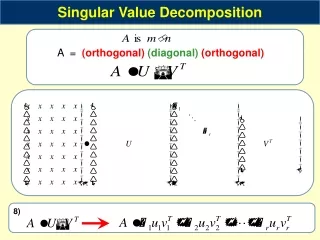
Singular Value Decomposition • Singular Value Decomposition (SVD) is a matrix factorization method. • Given as input an matrix , SVD computes matrices such that: • . • is an square matrix. • is an diagonal matrix (only entries are non-zero). • is an matrix. • In a bit, we will discuss how to compute matrices . • First, we need to understand: How can SVD be useful in our problem?
Consider . • It shows whether User 2 has watched Movie 3. • How do we compute using , , ? • Let be the second row of . • Let be the third row of . • Then, Movie 1 Movie 2 Movie 3 Movie 4 Movie 5 Movie 6 Movie 7 Movie 8 Movie 9 User 1 User 2 User 3 User 4 User 5 User 6 User 7 matrix diagonal matrix matrix
Consider . • It shows whether User 2 has watched Movie 3. • How do we compute using , , ? • Let be the second row of . • Let be the third row of . • Then, • Each row of is a vector representation of user . • Each row of is a vector representation of movie . • assigns a weight to each dimension of these vectors. • Score is the weighted dot product of and , where the weight of each dimension is value . matrix diagonal matrix matrix
Modeling Users and Movies • SVD gives us a way to model users and movies. • A user is a vector. • A movie is a vector. • The score corresponding to a user and a movie is the weighted dot product of these vectors. • The dimensions are ordered in decreasing order of importance. • The first dimension of the user vectors and the movie vectors is the most important for predicting the user/movie score. • Each next dimension becomes less important. • This is similar to PCA projections, where dimensions are also ordered in decreasing order of importance.
Making Predictions • How can we use SVDto guess the score for a user/movie pair? • This is similar to predicting missing values using PCA. • Using all eigenvectors, backprojection just produces the original input. • Using the top few eigenvectors, the backprojection provides a reasonable guess for the hidden pixels. • Why? Because the backprojection formula assumes that the missing data follows the statistical patterns of the training data. Backprojection using all eigenvectors. Occluded bottom half(input to PCA). Backprojection using 10 top eigenvectors.
Making Predictions • Suppose that . • This means that User has NOT watched Movie . • We would like to use matrices , , to guess if we should recommend Movie to User . • ??? Backprojection using all eigenvectors. Occluded bottom half(input to PCA). Backprojection using 10 top eigenvectors.
Making Predictions • Suppose that . • This means that User has NOT watched Movie . • We would like to use matrices , , to guess if we should recommend Movie to User . • , since . Backprojection using all eigenvectors. Occluded bottom half(input to PCA). Backprojection using 10 top eigenvectors.
Making Predictions • However, if we use the top few dimensions of and , we get something similar to PCA backprojections guessing missing values. • These first few dimensions are not enough to perfectly reconstruct matrix . • Predictions made using these first few dimensions assume that the value we want to predict matches the statistical patterns described by , where some users have similar preferences, and some movies have similar ratings. Backprojection using all eigenvectors. Occluded bottom half(input to PCA). Backprojection using 10 top eigenvectors.
Full-Dimensional SVD Movie 1 Movie 2 Movie 3 Movie 4 Movie 5 Movie 6 Movie 7 Movie 8 Movie 9 User 1 User 2 User 3 User 4 User 5 User 6 User 7 matrix diagonal matrix matrix
-Dimensional SVD Movie 1 Movie 2 Movie 3 Movie 4 Movie 5 Movie 6 Movie 7 Movie 8 Movie 9 User 1 User 2 User 3 User 4 User 5 User 6 User 7 matrix diagonal matrix matrix
Testing -Dimensional SVD Movie 1 Movie 2 Movie 3 Movie 4 Movie 5 Movie 6 Movie 7 Movie 8 Movie 9 User 1 User 2 • If this is our ratings matrix , how can we test SVD to see how well it works? • We will hide some values we know, and see if we can guess them using SVD. • The values we will hide are marked in red. User 3 User 4 User 5 User 6 User 7
Testing -Dimensional SVD Movie 1 Movie 2 Movie 3 Movie 4 Movie 5 Movie 6 Movie 7 Movie 8 Movie 9 User 1 User 2 • Thus, we get a training matrix data, where the values we hide are set to 0. • These are movies that we know that the user watched. • If SVD learned something reasonable, it should predict a high score for those values. User 3 User 4 User 5 User 6 User 7 Training Matrix
Testing -Dimensional SVD Movie 1 Movie 2 Movie 3 Movie 4 Movie 5 Movie 6 Movie 7 Movie 8 Movie 9 User 1 User 2 • We do SVD on the training matrix. • How to do SVD is something we have not discussed yet, we'll get to it. • We only keep the first 4 columns of and . • So, . User 3 User 4 User 5 User 6 User 7 Training Matrix
Movie 1 Movie 2 Movie 3 Movie 4 Movie 5 Movie 6 Movie 7 Movie 8 Movie 9 Training Matrix User 1 • Colors: • Red: hidden values • Green: 1 in training matrix. • Rest: 0 in training matrix User 2 User 3 User 4 User 5 User 6 User 7 , with .
Movie 1 Movie 2 Movie 3 Movie 4 Movie 5 Movie 6 Movie 7 Movie 8 Movie 9 Training Matrix • In : • Positions that are 1 in training matrix get high values. • Positions that are 0 in training matrix get lower values. User 1 User 2 User 3 User 4 User 5 User 6 User 7 , with .
Movie 1 Movie 2 Movie 3 Movie 4 Movie 5 Movie 6 Movie 7 Movie 8 Movie 9 Training Matrix User 1 • In : • Positions of hidden values get relatively high scores. User 2 User 3 User 4 User 5 User 6 User 7 , with .
Movie 1 Movie 2 Movie 3 Movie 4 Movie 5 Movie 6 Movie 7 Movie 8 Movie 9 Training Matrix • In : • Consider row 6 col 7. • The value is 0.22. • In that row, all other values are lower, except for col 3, where the value was 1 in the training matrix. User 1 User 2 User 3 User 4 User 5 User 6 User 7 , with .
Movie 1 Movie 2 Movie 3 Movie 4 Movie 5 Movie 6 Movie 7 Movie 8 Movie 9 Training Matrix • In : • So, if we were to recommend a movie for User 6, which one would we recommend? • The movie with highest score, among all movies that User 6 did not watch. User 1 User 2 User 3 User 4 User 5 User 6 User 7 , with .
Movie 1 Movie 2 Movie 3 Movie 4 Movie 5 Movie 6 Movie 7 Movie 8 Movie 9 Training Matrix • We would recommend: • Movies 6 and 9 to User 5. • Movie 7 to User 6. • Movie 6 to User 7. • 3 out of the 4 recommendations are movies that these users did watch (and SVD did not know). User 1 User 2 User 3 User 4 User 5 User 6 User 7 , with .
Computing SVD • Let be any matrix. • We want to compute the SVD decomposition of . • In other words, we want to find matrices , , , such that: • is an square matrix. • is an diagonal matrix (only entries are non-zero). • . So, the diagonal entries of appear in decreasing order. • is an matrix.
Computing SVD • Let be any matrix. • We want to compute the SVD decomposition of . • Then: • The columns of are the eigenvectors of , in decreasing order of the corresponding eigenvalues. • The columns of are the eigenvectors of , in decreasing order of the corresponding eigenvalues. • The diagonal entries of are the square roots of the eigenvalues of , in decreasing order. • You can compute , , via the power method. • Better methods are also available.
The MovieLens Dataset • The Netflix dataset is not publicly available anymore. • The MovieLensdataset is a similar dataset that is publicly available. • It has: • 20 million movie ratings. • 138,000 users. • 27,000 movies. • There is a "small" version of that dataset, with: • 100,000 movie ratings. • 700 users. • 9,000 movies.
Trying SVD on MovieLens • We will use the "small" MovieLens dataset to repeat the experiment we did before with our toy example. • We convert the ratings matrix to a binary (0/1) matrix. • 0 stands for "user did not watch movie". • 1 stands for "user watched movie". • 98.4% of the binary matrix values are equal to 0. • 1.6% of the binary matrix values are equal to 1. • We want to use SVD to recommend movies to users. • How can we test how well SVD works?
Trying SVD on MovieLens • We create a training matrix, by randomly choosing half of the 1 values, and "hiding" them (setting them to 0). • These hidden values are 0 in the training data, but we know that users actually watched those movies. • We can assume that users were interested in those movies, and it would have been a good idea to recommend those movies to those users. • If SVD gives high scores to those movies, it means that it has learned a good model for making movie recommendations.
Issues with Evaluating Accuracy • In general, evaluating prediction accuracy is a non-trivial task. • This is an issue in general classification tasks as well. • This is simply our first encounter with some of the complexities that arise. • Oftentimes people do not understand the underlying issues, and report numbers that are impressive, but meaningless.
Issues with Evaluating Accuracy • For example: consider the Movielens. • Suppose we build a model that says that each user is not interested in any movie that is not marked as "watched" in the training data. • How accurate is that model? • How do we evaluate that accuracy? • Intuitively, we know that such a model is pretty useless. • We know for a fact that some zeros in the training matrix were corresponding to "hidden" ones. • How can we capture quantitatively the fact that the model is very bad?
Issues with Evaluating Accuracy • Our training matrix contains some ones and some zeros. • The ones are known values. • The zeros may be true zeros, or they may be true ones that were "hidden". • If we use -dimensional SVD, we get an estimated score matrix. • Remember, for our toy example, we got the matrix shown above. • How can we convert those values to predictions?
Issues with Evaluating Accuracy • We can choose a threshold . • All values correspond to prediction "1" (i.e., to prediction that we should recommend that movie). • All values correspond to prediction "0" (i.e., to prediction that we should recommend that movie). • How should we choose a threshold? Based on accuracy? We end up with the same issue: how should we measure accuracy?
Issues with Evaluating Accuracy • Going back to the MovieLens dataset: • Once we get predictions of ones and zeros, we can compare them against the ones and zeros of the true data matrix. • In the true data matrix the "hidden" ones show as actual ones. • In measuring accuracy, we will exclude the positions where the training matrix contains "1" values. • The goal is to use the predictions to recommend movies. • If we have a "1" in the training matrix, we know that the user watched that movie, so there is no point in recommending that movie to that user.
Issues with Evaluating Accuracy • So, suppose that we choose a threshold of . • As humans, we know that this is a bad idea. • All predictions are "0", we do not make any recommendations. • What is the accuracy? • The true score matrix has about 6 million values. • 50,000 of those values are set to "1" in both the true score matrix and the training matrix. • We do not use those values to evaluate accuracy. • About 6 million values are set to "0" in the training matrix. • These are the values that we will use to evaluate accuracy.
Issues with Evaluating Accuracy • So, we have about 6,000,000 predictions to evaluate. • All those predictions are equal to 0. • Because we chose a threshold of . • Based on the true score matrix: • 50,000 of those predictions are wrong, because they correspond to hidden ones. • About 6,000,000 predictions are right. • Classic mistake #1: evaluate accuracy using this formula: • Accuracy = • 99.17% sounds pretty impressive, but it is misleading. • The system is useless, it does not make any recommendations.
Issues with Evaluating Accuracy • One issue is that the classes are asymetrically distributed. • There are way more "0" values than "1" values. • Many machine learning problems are like that. • Another example: face detection in images. • In many datasets, more than 99.9% of image windows are NOT faces. • A face detector that never detects any faces is 99.9% accurate. • Another issue is that the final prediction depends on an arbitrary threshold.
Balanced Accuracy Rate • When we have asymmetric class distributions, a useful measure is the balanced accuracy rate: • First, calculate the accuracy rate separately for objects belonging to each class. • The balanced accuracy rate is the average of those class-specific error rates. • In our example, using a threshold of : • The overall accuracy is 99.17%. • This is an impressive and useless number. • The balanced accuracy rate is 50%. • 100% for true 0 values, and 0% for true 1 values. • This is a far more informative measure of accuracy.
Precision vs. Recall • Movie recommendation can be thought of as a retrieval problem. • There are lots of possible items to recommend. • Only few of those items are relevant. • Any system that makes recommendations can be evaluated using two measures: • Precision: the fraction of retrieved items that are relevant. • In our case: . • Recall: the fraction of relevant items that are retrieved. • In our case:.
Precision vs. Recall • Suppose that we have two methods, A and B. • Suppose that each of these methods uses a threshold to produce the final results. • Classic mistake #2: • "Method A achieved a precision of 90% and a recall of 80%". • "Method B achieved a precision of 92% and a recall of 60%". • If the results of A and B depend on thresholds, you should never report results using a single threshold. • Instead, you should show a precision vs. recall plot.
Precision vs. Recall • Here we see an example figure of precision vs. recall. • It shows, for many different thresholds, the precision and recall rates attained with SVD on the MovieLens dataset. • We have one plot for , and one for . • Does this plot tell us which choice of is better? • Yes! gives consistently better results than .
Choosing a Threshold • The choice of threshold makes a big difference. • A low threshold leads to: • A higher number of total recommendations. • Consequently, higher recall (higher number of correct items are recommended). • A smaller percentage of correct recommendations among the recommendations that are made. • Consequently, lower precision.
Choosing a Threshold • The choice of threshold makes a big difference. • A high threshold leads to: • A lower number of total recommendations. • Consequently, lower recall (lower number of correct items are recommended). • A larger percentage of correct recommendations among the recommendations that are made. • Consequently, higher precision.