Chapter 55
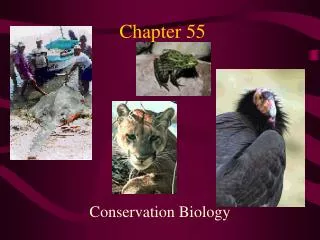
Chapter 55. Ecosystems. An ecosystem consists of all the organisms living in a community As well as all the abiotic factors with which they interact They can be very small or very large. Aquarium. Coniferous Forest. Energy Flow and Chemical Cycling.

Chapter 55
E N D
Presentation Transcript
Chapter 55 Ecosystems
An ecosystem consists of all the organisms living in a community • As well as all the abiotic factors with which they interact • They can be very small or very large Aquarium Coniferous Forest
Energy Flow and Chemical Cycling • Ecosystem ecology emphasizes energy flow and chemical cycling • Ecosystem ecologists view ecosystems • As transformers of energy and processors of matter
Ecosystems and Physical Laws • The laws of physics and chemistry apply to ecosystems • Particularly in regard to the flow of energy • Energy is conserved • But degraded to heat during ecosystem processes (energy transformations are inefficient…some energy is always lost as heat)
Trophic Relationships • Energy and nutrients pass from primary producers (autotrophs) • To primary consumers (herbivores) and then to secondary consumers (carnivores)
Tertiary consumers Microorganisms and other detritivores Secondary consumers Primary consumers Detritus Primary producers Heat Key Chemical cycling Sun Energy flow • Energy flows through an ecosystem • Entering as light and exiting as heat Detritus is dead organic material
Nutrient cycling • Nutrients cycle within an ecosystem
Decomposition • Connects all trophic levels • Detritivores, mainly bacteria and fungi, recycle essential chemical elements • By decomposing organic material and returning elements to inorganic reservoirs
Primary Production • Primary production in an ecosystem • Is the amount of light energy converted to chemical energy by autotrophs during a given time period • Physical and chemical factors limit primary production in ecosystems
Ecosystem Energy Budgets • The extent of photosynthetic production • Sets the “spending limit” for the energy budget of the entire ecosystem
The Global Energy Budget • The amount of solar radiation reaching the surface of the Earth • Limits the photosynthetic output of ecosystems • Only a small fraction of solar energy • Actually strikes photosynthetic organisms • And only ~1% of that is converted to chemical energy by photosynthesis • …still that’s a lot of energy
Gross and Net Primary Production • Total primary production in an ecosystem • Is known as that ecosystem’s gross primary production (GPP) • Not all of this production is stored as organic material in the growing plants (The plants use some of the energy for the fuel of day-to-day living) • Net primary production (NPP) • Is equal to GPP minus the energy used by the primary producers for respiration • It is the amount of new biomass added in a given time period • Only NPP is available to consumers
125 Open ocean 24.4 65.0 360 Continental shelf 5.2 5.6 1,500 Estuary 0.3 1.2 Algal beds and reefs 2,500 0.1 0.9 Upwelling zones 0.1 500 0.1 Extreme desert, rock, sand, ice 3.0 4.7 0.04 0.9 90 Desert and semidesert scrub 3.5 Tropical rain forest 2,200 22 3.3 2.9 Savanna 900 7.9 9.1 2.7 Cultivated land 600 Boreal forest (taiga) 9.6 2.4 800 1.8 Temperate grassland 600 5.4 Woodland and shrubland 700 1.7 3.5 Tundra 0.6 1.6 140 Tropical seasonal forest 1,600 7.1 1.5 Temperate deciduous forest 1,200 1.3 4.9 1,300 Temperate evergreen forest 1.0 3.8 0.4 Swamp and marsh 2,000 2.3 Lake and stream 0.4 250 0.3 0 10 20 30 40 50 60 0 500 1,000 1,500 2,000 2,500 0 5 10 15 20 25 Key Percentage of Earth’s net primary production Average net primary production (g/m2/yr) (a) (b) Percentage of Earth’s surface area Marine Terrestrial Freshwater (on continents) • Different ecosystems vary considerably in their net primary production and in their contribution to the total NPP on Earth (c)
North Pole 60N 30N Equator 30S 60S South Pole 120W 180 0 60E 120E 180 60W • The open ocean contributes relatively little per unit of area…but there is an awful lot of area. • Forested areas contribute a great deal per unit area Regional annual NPP (light violet lowestred highest)
Primary Production in Marine and Freshwater Ecosystems • In marine and freshwater ecosystems • Both light and nutrients are important in controlling primary production
Light Limitation • The depth of light penetration • Affects primary production throughout the photic zone of an ocean or lake
Nutrient Limitation • More than light, nutrients limit primary production • A limiting nutrient is the element that must be added • In order for production to increase in a particular area • Nitrogen and phosphorous • Are typically the nutrients that most often limit marine production
The addition of large amounts of nutrients to lakes has a wide range of ecological impacts • In some areas, sewage runoff has caused eutrophication (overnourishment?) of lakes, which can lead to the eventual loss of most fish species from the lakes The overnourished upper lake has a tremendous cyanobacterial bloom Phosphorus is often the limiting nutrient for cyanobacterial growth. Oversupply leads to blooms
Primary Production in Terrestrial and Wetland Ecosystems • In terrestrial and wetland ecosystems climatic factors • Such as temperature and moisture, affect primary production on a large geographic scale
3,000 Tropical forest 2,000 Net primary production (g/m2/yr) Temperate forest 1,000 Mountain coniferous forest Desert shrubland Temperate grassland Arctic tundra 0 500 1,000 1,500 Actual evapotranspiration (mm H2O/yr) 0 Actual Evapotranspiration • The contrast between wet and dry climates can be represented by a measure called actual evapotranspiration • Actual evapotranspiration • Is the amount of water annually transpired by plants and evaporated from a landscape • Is related to net primary production (warm and moist is better than cold and dry)
EXPERIMENT Over the summer of 1980, researchers added phosphorus to some experimental plots in the salt marsh, nitrogento other plots, and both phosphorus and nitrogen to others. Some plots were left unfertilized as controls. Adding nitrogen (N) boosts net primary production. RESULTS 300 N P 250 200 Live, above-ground biomass (g dry wt/m2) N only 150 100 Control P only 50 0 July August 1980 June Experimental plots receiving just phosphorus (P) do not outproduce the unfertilized control plots. CONCLUSION These nutrient enrichment experiments confirmed that nitrogen was the nutrient limiting plant growth in this salt marsh. • On a local scale • A soil nutrient is often the limiting factor in primary production
Secondary Production • Energy transfer between trophic levels is usually less than 20% efficient • The secondary production of an ecosystem • Is the amount of chemical energy in consumers’ food that is converted to their own new biomass during a given period of time
Plant material eaten by caterpillar 200 J Cellular respiration 67 J 100 J Feces 33 J Growth (new biomass) Production Efficiency • When a caterpillar feeds on a plant leaf • Only about one-sixth of the energy in the leaf is used for secondary production • The production efficiency of an organism • Is the fraction of energy stored in food that is not used for respiration 67J of the 100J of assimilated energy is used for respiration. 33J of 100J is new biomass…so the PE is 33% Nondigested materials aren’t figured into PE
Production efficiency • Endotherms (birds and mammals) have low production efficiencies. In the range of 1-3% • A lot of energy is used to maintain that constant body temp. • Ectotherms have higher production efficiencies • Fish at ~10% • Insects at around 40%
Trophic Efficiency and Ecological Pyramids • Trophic efficiency • Is the percentage of production transferred from one trophic level to the next • Usually ranges from 5% to 20%
Tertiary consumers 10 J Secondary consumers 100 J Primary consumers 1,000 J Primary producers 10,000 J 1,000,000 J of sunlight Pyramids of Production • The loss of energy with each transfer in a food chain can be represented by a pyramid of net production
Dry weight (g/m2) Trophic level Tertiary consumers 1.5 Secondary consumers 11 37 Primary consumers Primary producers 809 Pyramids of Biomass • Most biomass pyramids • Show a sharp decrease at successively higher trophic levels
Dry weight (g/m2) Trophic level 21 Primary consumers (zooplankton) Primary producers (phytoplankton) 4 (b) In some aquatic ecosystems, such as the English Channel, a small standing crop of primary producers (phytoplankton)supports a larger standing crop of primary consumers (zooplankton). • Certain aquatic ecosystems can have inverted biomass pyramids • Here the phytoplankton (algae) grow very rapidly and are very productive but their consumption by zooplankton holds the population size down
Trophic level Number of individual organisms Tertiary consumers 3 Secondary consumers 354,904 Primary consumers 708,624 Primary producers 5,842,424 Pyramids of Numbers • A pyramid of numbers • Represents the number of individual organisms in each trophic level
The dynamics of energy flow through ecosystems • Have important implications for the human population • Eating meat • Is a relatively inefficient way of tapping photosynthetic production
Trophic level Secondary consumers Primary consumers Primary producers • Worldwide agriculture could successfully feed many more people • If humans all fed more efficiently, eating only plant material (processing the plant material through another food animal decreases efficiency of energy transfer) Relative food energy available to the human population at different trophic levels
The Green World Hypothesis • Most terrestrial ecosystems have large standing crops despite the large numbers of herbivores • According to the green world hypothesis • Terrestrial herbivores consume relatively little plant biomass because they are held in check by a variety of factors
The green world hypothesis proposes several factors that keep herbivores in check • Plants have defenses against herbivores • Nutrients, not energy supply, usually limit herbivores (paucity of essential nutrients in their diet) • Abiotic factors limit herbivores (temperature, water availability) • Intraspecific competition can limit herbivore numbers (territoriality, competition, etc.) • Interspecific interactions check herbivore densities (predators, parasites, disease, etc)
Chemical Cycling • Biological and geochemical processes move nutrients between organic and inorganic parts of the ecosystem • Life on Earth • Depends on the recycling of essential chemical elements • Nutrient circuits that cycle matter through an ecosystem • Involve both biotic and abiotic components and are often called biogeochemical cycles
THE CARBON CYCLE THE WATER CYCLE CO2 in atmosphere Transport over land Photosynthesis Solar energy Cellular respiration Net movement of water vapor by wind Precipitation over land Precipitation over ocean Evaporation from ocean Burning of fossil fuels and wood Evapotranspiration from land Higher-level consumers Primary consumers Percolation through soil Carbon compounds in water Detritus Runoff and groundwater Decomposition Biogeochemical Cycles • The water cycle and the carbon cycle Water moves in a global cycle driven by solar energy The carbon cycle reflects the reciprocal processes of photosynthesis and cellular respiration
THE PHOSPHORUS CYCLE THE NITROGEN CYCLE N2 in atmosphere Rain Plants Weathering of rocks Geologic uplift Runoff Assimilation Denitrifying bacteria Consumption NO3 Sedimentation Nitrogen-fixing bacteria in root nodules of legumes Plant uptake of PO43 Decomposers Nitrifying bacteria Soil Nitrification Leaching Ammonification NO2 NH3 NH4+ Nitrogen-fixing soil bacteria Nitrifying bacteria Decomposition More Biogeochemical Cycles The nitrogen cycle and the phosphorous cycle
Consumers Producers Decomposers Nutrients available to producers Abiotic reservoir Geologic processes Decomposition and Nutrient Cycling Rates • Decomposers (detritivores) play a key role in the general pattern of chemical cycling • The rates at which nutrients cycle in different ecosystems are extremely variable, mostly as a result of differences in rates of decomposition
Human activities • The human population is disrupting chemical cycles throughout the biosphere • As the human population has grown in size • Our activities have disrupted the trophic structure, energy flow, and chemical cycling of ecosystems in most parts of the world
Agriculture and Nitrogen Cycling • Agriculture constantly removes nutrients from ecosystems that would ordinarily be cycled back into the soil
Nitrogen is the main nutrient lost through agriculture • Thus, agriculture has a great impact on the nitrogen cycle • Industrially produced fertilizer is typically used to replace lost nitrogen, but the effects on an ecosystem can be harmful
Nutrient Enrichment • In addition to transporting nutrients from one location to another…Humans have added entirely new materials, some of them toxins, to ecosystems
Contamination of Aquatic Ecosystems • The critical load for a nutrient • Is the amount of that nutrient that can be absorbed by plants in an ecosystem without damaging it • When excess nutrients are added to an ecosystem, the critical load is exceeded • And the remaining nutrients can contaminate groundwater and freshwater and marine ecosystems
Sewage runoff contaminates freshwater ecosystems • Causing eutrophication, excessive algal growth, which can cause significant harm to these ecosystems
Acid Precipitation • Combustion of fossil fuels • Is the main cause of acid precipitation
4.6 4.3 4.6 4.3 4.6 4.1 4.3 4.6 Europe North America • North American and European ecosystems downwind from industrial regions • Have been damaged by rain and snow containing nitric and sulfuric acid Numbers indicate the average pH of precipitation in that area
Field pH 5.3 5.2–5.3 5.1–5.2 5.0–5.1 4.9–5.0 4.8–4.9 4.7–4.8 4.6–4.7 4.5–4.6 4.4–4.5 4.3–4.4 4.3 • By the year 2000 the entire contiguous United States was affected by acid precipitation (defined as precipitation less than pH 5.6)
Toxins in the Environment • Humans release an immense variety of toxic chemicals • Including thousands of synthetics previously unknown to nature (Xenobiotic) • One of the reasons such toxins are so harmful • Is that they become more concentrated in successive trophic levels of a food web • In some cases, harmful substances • Persist for long periods of time in an ecosystem and continue to cause harm
Herring gull eggs 124 ppm Lake trout 4.83 ppm Concentration of PCBs Smelt 1.04 ppm Zooplankton 0.123 ppm Phytoplankton 0.025 ppm • In biological magnification • Toxins concentrate at higher trophic levels because at these levels biomass tends to be lower Fewer individuals each with high concentration of toxin Small concentrations of toxin spread among many individuals
Atmospheric Carbon Dioxide • The rising level of atmospheric carbon dioxide is human in origin