Download
1 / 44
440 likes | 537 Views
Education, Social Equality , and Economic Growth : A View of the Landscape. Thorvaldur Gylfason and Gylfi Zoega. The Scheme of Things: Sources of Growth. +. +. denotes a positive effect in the direction shown. +. The Scheme of Things: Sources of Growth.

E N D
Education, Social Equality, and Economic Growth: A View of the Landscape Thorvaldur Gylfason and Gylfi Zoega
The Scheme of Things: Sources of Growth + + denotes a positive effect in the direction shown +
The Scheme of Things: Sources of Growth Adam Smith knew all this, and more + + denotes a positive effect in the direction shown +
The Scheme of Things: More Sources of Growth + + ? denotes a positive effect in the direction shown +
The Scheme of Things: More Sources of Growth Arthur Lewis: x is trade, stable politics, good weather Then Solow came along and said: growth is exogenous + + ? denotes a positive effect in the direction shown +
The Scheme of Things: More Sources of Growth Endogenous growth: x can be almost anything! + + – ? – + denotes a positive effect in the direction shown + denotes a negative effect in the direction shown –
The Scheme of Things: Inflation and Growth My first x was inflation (1976, 1991, 1996, 2001) + + – – – + denotes a positive effect in the direction shown + denotes a negative effect in the direction shown –
The Scheme of Things: Resources and Growth + + – – – + – –
The Scheme of Things: Ownership and Growth + + – – – + – –
The Scheme of Things: Aid and Growth A newx will be foreign aid vs. FDI (with Radetzki et al.) – – + + – – – + – + –
The Scheme of Things:Inequality and Growth Today x is inequality (with Zoega) – + + – – – + –
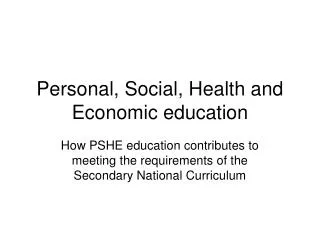
Aims and overview • Explore the relationship between inequality and education across countries since 1965 • Explore also the linkages between education and economic growth across countries since 1965 • Hypothesis: Education stimulates growththrough increased equality
Background Commonly held view: Economic efficiency and social equality are incompatible, like oil and water Okun’s “big trade-off” Redistribution is costly • Blunts incentives to work and save and invest in education • Leaky-bucket analogy
Background: More recent arguments 1. Political economy Inequality may trigger demands for redistribution that hurts growth It may also trigger demands for more and better education that helps growth 2. Social cohesion Inequality may lead to social conflict and political instability that hinder growth It may also lead to economic volatility
Background:More recent arguments 3.National saving Inequality may stimulate saving and hence also economic growth That is, if the rich save more that the poor But count the yachts! 4.Education Inequality may hurt or helpeducation Help? Poor countries and politics Hurt? Rich countries and imperfect markets
Research strategy Study 87 industrial and developing countries from 1965 to 1998 Look for cross-country patterns in data from the World Bank • Inequality and growth • Inequality and education • Education and growth Dig deeper through regression analysis
Inequality and economic growth What is the empirical evidence? r = rank correlation A 12 point increase in the Gini index goes along with a decrease in per capita growth by nearly 1% per year. r = -0.50 75 countries
The Gini index and the 20/20 ratio The Gini index is closely related to the 20/20 ratio • Gini = 25 ratio = 3 (Nordic countries) • Gini = 30 ratio = 4 (Germany) • Gini = 35 ratio = 6 (Britain) • Gini = 40 ratio = 8 (US, China, Russia) • Gini = 50 ratio = 15 (Nigeria) • Gini = 60 ratio = 26 (Brazil) Relationship between inequality and growth also holds for rich and poor separately
The Gini index and the 20/20 ratio The Gini index is closely related to the 20/20 ratio • Gini = 25 ratio = 3 (Nordic countries) • Gini = 30 ratio = 4 (Germany, Greece) • Gini = 35 ratio = 6 (Britain) • Gini = 40 ratio = 8 (US, China, Russia) • Gini = 50 ratio = 15 (Nigeria) • Gini = 60 ratio = 26 (Brazil) Each ten-point increase in the Gini index roughly doubles the 20/20 ratio
Education and inequality: The missing link? Now consider the linkages between inequality and different measures of education The aim is to see if such linkages can help explain the observed cross-country pattern of inequality and economic growth
More on education Specifically, consider the relationship between inequality and three different measures of education inputs, outcomes, and participation: 1. Public expenditure on education 2. Expected years of schooling for girls 3. Secondary-school enrolment
Expenditure on education and inequality r = -0.36 An increase in public expenditure on education by 1% of GNP is associated with a 2.3 point decrease in Gini. 74 countries
Expenditure on education and economic growth An increase in public expenditure on education by 3½% of GNP is associated with an increase in per capita growth by 1% per year. r = 0.29 87 countries
Years of schooling and inequality r = -0.49 An increase by one year in the schooling that girls can expect is associated with a decrease of almost one point on the Gini scale. 46 countries
Years of schooling and economic growth An increase by four years in the schooling that girls can expect is associated with an increase in per capita growth by 1% per year. r = 0.50 49 countries
Secondary enrolment and inequality An increase in the secondary-school enrolment rate by five percentage point goes along with a decrease of almost one point on the Gini scale. r = -0.54 75 countries
Secondary enrolment and economic growth r = 0.69 An 25-30 point increase in secondary-school enrolment goes along with an increase in per capita growth by 1% per year. 87 countries
Secondary enrolment and growth, again r = 0.69 Diminishing returns to education: The additional benefit from education becomes smaller as enrolment increases 87 countries
The Kuznets curve Inequality tends to increase with income at low levels of income and to decrease with income at higher levels of income 75 countries
Summary of results We have seen that, across countries: • Economic growth varies inversely inequality • Three different measures of education intended to reflect education inputs, outcomes, and participation are all inversely related to inequality • Economic growth varies directly with all three measures of education
One possible interpretation of results Growth Growth Inequality = + Education Inequality Education
Another possible interpretation Growth Growth Education = + Inequality Education Inequality
Regression results Note: 87 observations. Method of estimation is SUR. t-statistics are shown within parentheses.
Regression results Direct effect of natural capital on growth is -0.06 Note: 87 observations. Method of estimation is SUR. t-statistics are shown within parentheses.
Regression results Indirect effect through investment is -0.20·0.13 -0.03 Note: 87 observations. Method of estimation is SUR. t-statistics are shown within parentheses.
Regression results E = 35 Indirect effect through education is -(0.71/E)·0.71 -0.015 Note: 87 observations. Method of estimation is SUR. t-statistics are shown within parentheses.
Regression results Total effect of natural capital is -0.06 - 0.03 - 0.015 -0.10 Note: 87 observations. Method of estimation is SUR. t-statistics are shown within parentheses.
Regression results Note: 87 observations. Method of estimation is SUR. t-statistics are shown within parentheses.
Regression results E = 35 Direct effect of education on growth is 0.71/E 0.02 Note: 87 observations. Method of estimation is SUR. t-statistics are shown within parentheses.
Regression results Indirect effect through inequality is (-0.16)·(-0.03) 0.005 Note: 87 observations. Method of estimation is SUR. t-statistics are shown within parentheses.
Regression results E = 35 Total effect of education is 0.71/E + (-0.16)·(-0.03) 0.025 Note: 87 observations. Method of estimation is SUR. t-statistics are shown within parentheses.
Summary of results on education An increase in enrolment by 20 points • increases growth directly by 0.4 percentage points ... • ... reduces the Gini index by 3.2 points • ... and this, in turn, increases growth further by 0.1 percentage point So, the total effect on growth is 0.5 percentage points – not small at all!
Marshallgot it right There is no extravagance more prejudicial to growth of national wealth than that wasteful negligence which allows genius that happens to be born of lowly parentage to expend itself in lowly work. No change would conduce so much to a rapid increase of material wealth as an improvement in our schools. ALFRED MARSHALL (1920)
Conclusion Education encourages economic growth 1. by increasing and improving human capital ... 2. ... and also social capital, by reducing inequality There is no evidence, however, that education influences economic growth through physical capital The End