Cumulative Frequency and Box Plots
120 likes | 302 Views
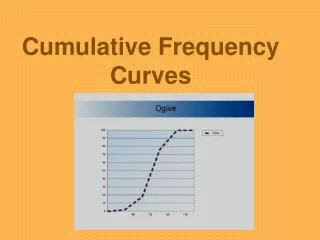
Cumulative Frequency and Box Plots. Learning Objectives. To be able to draw a cumulative frequency curve and use it to estimate the median and interquartile range and draw a box plot. Does anybody remember how to draw a Cumulative Frequency Diagram?. Cumulative Frequency Curves

Cumulative Frequency and Box Plots
E N D
Presentation Transcript
Learning Objectives • To be able to draw a cumulative frequency curve and use it to estimate the median and interquartile range and draw a box plot
Does anybody remember how to draw a Cumulative Frequency Diagram?
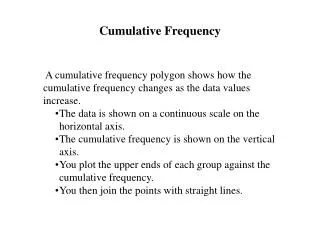
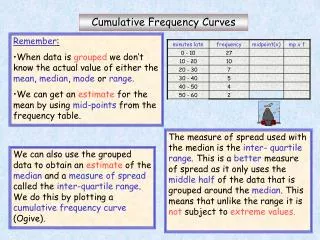
Cumulative Frequency Curves • Cumulative Frequency = a running total of the data • Median = Half way up the Cumulative Frequency • Lower Quartile(LQ) = ¼ way up Cum Freq • Upper Quartile (UQ) = ¾ way up Cum Freq • Inter Quartile Range = UQ - LQ
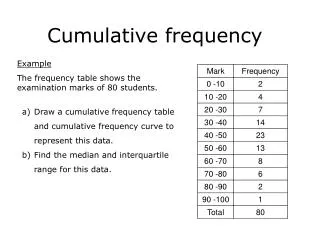
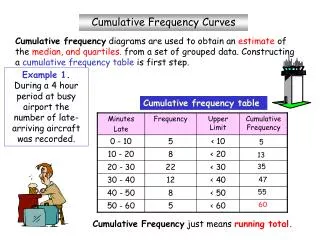
Big Worked Example The table below shows the number of minutes students were late for their fun algebra lesson. (a) Draw a Cumulative Frequency Diagram of the data (b) Use it to find the Median, Lower Quartile, Upper Quartile, and Inter Quartile Range (c) Draw a Box-Plot assuming a minimum time of o minutes and a maximum of 25 minutes
x 80 x Cum freq 60 x Median = Middle Value 40 • QUARTILES • Lower Quartile = ¼ way • Upper Quartile = ¾ way x 20 x 8½ 12½ 15½ 5 10 15 20 25 t mins Interquartile Range = 15½ - 8½ = 7 mins
1 2 5 3 4 Box Plots • Box Plots (Box and Whisker Diagram) are another way of displaying data for comparison • To draw a Box Plot we need FIVE pieces of information: • 1. The Minimum Value • 2. Lower Quartile (Q1) • 3. The Median (Q2) • 4. Upper Quartile (Q3) • 5. Maximum Value • They are drawn in the following way: • BOX = The location of the middle 50% of the data • WHISKERS = How the data is spread overall
70 60 50 ¾ 40 Cumulative Frequency ½ IQR = 38 – 21 = 17 mins 30 20 ¼ Median = 27 10 UQ = 38 LQ = 21 0 40 50 20 30 60 70 10 Minutes Late 20 0 10 30 40 50 60 Box Plot from Cumulative Frequency Curve
Lower Quartile Lowest value Highest value Median Upper Quartile 0 5 10 15 20 25 t mins Box Plot
Work • Ex 7:1 • Page 62 • Questions 5 and 6