Download
1 / 1
10 likes | 85 Views
Explore dynamic changes in percent modulation and cycles per scan in brain regions using fMRI data. Track variations in coherence modulation across different time points for deeper insights into brain activity.

E N D
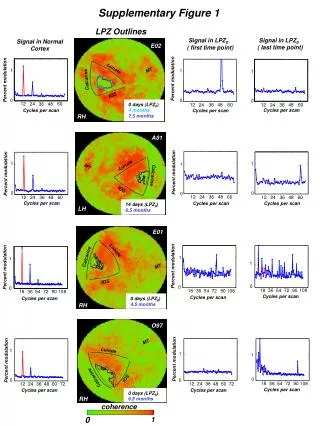
Supplementary Figure 1 coherence E02 1 MT Lunate Percent modulation Percent modulation Calcarine 0 12 60 24 36 48 36 48 36 48 12 60 12 60 24 24 Cycles per scan Cycles per scan Cycles per scan IOS 0 days (LPZ0) 4 months 7.5 months 0 1 RH A01 Lunate 1 MT Calcarine Percent modulation Percent modulation IOS 0 36 48 12 60 24 36 48 36 48 12 60 12 60 24 24 Cycles per scan Cycles per scan Cycles per scan 14 days (LPZ0) 6.5 months LH E01 Calcarine Lunate MT 1 1 1 Percent modulation Percent modulation IOS 0 0 0 36 108 54 72 18 90 54 72 18 90 108 36 54 72 18 90 108 36 Cycles per scan Cycles per scan Cycles per scan 0 days (LPZ0) 4.5 months RH O97 MT 1 Lunate 1 Percent modulation Percent modulation 1 Calcarine IOS 0 0 18 90 36 108 54 72 36 48 12 60 24 72 Cycles per scan Cycles per scan 0 days (LPZ0) 6.5 months 0 RH 12 60 24 72 36 48 Cycles per scan LPZ Outlines Signal in LPZ0 ( last time point) Signal in LPZ0 ( first time point) Signal in Normal Cortex 1 1 0 0 1 1 0 0


