Download

1 / 28
280 likes | 468 Views
Allocating Spending. Afternoon Session Part I. Topics. Allocating Spending to Children Direct methods: Per Capita and USDA Indirect methods: Engel and Rothbarth Break Data -- Consumer Expenditure Survey Choosing values for an Economic Table. Big Questions.

E N D
Allocating Spending Afternoon Session Part I
Topics • Allocating Spending to Children • Direct methods: Per Capita and USDA • Indirect methods: Engel and Rothbarth • Break • Data -- Consumer Expenditure Survey • Choosing values for an Economic Table
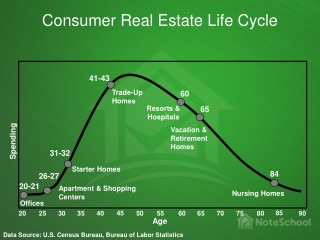
Big Questions • What proportion of the family’s spending can be attributed to spending on the children? • How does the proportion of spending devoted to the children change as total spending increases? • How does the number of children in the family affect the proportion devoted to the children?
Allocating Spending • A family of three (two parents and a child) spends during the year, $40,000 -- how much did they spend on the child? • Types of Spending • Personal Spending Categories • Shared or Joint Spending Categories • Equal Sharing of all Spending -- Per Capita Children’s Share = K/(K+A) K is the number of Children and A is the number of Adults
USDA Approach • Personal Spending -- Direct allocation to children and adults: • Adults (7%): clothing, alcohol, tobacco,personal insurance, miscellaneous, cash contributions • Children (6%): clothing, child care • Allocations based upon research or assumptions (43%) • Food (allocation based upon nutritional requirements) • Transportation (based upon DOT research) • Medical Spending (based upon DHHS research) • Other Shared Consumption (44%) -- Per Capita Allocation
Special Allocations • Food (adult equivalent needs -- each adult is 1) Age 0-2 3-5 6-12 13-15 16-17 .511 .570 .802 .943 .969 Sum the adult equivalent needs for the children (sum = F) then the amount of food spending on the children would equal F/(F+A) • Transportation Allocate non-work related expenses on a per capita basis. If youngest child is 0 to 5 then work expenses is 40%, otherwise work related expenses is 38%. • Medical Spending (adult equivalent needs) Age is 0 to 5, the scale is .696. If age is 6 to 17, the scale is .786
Family Spending by Category Food $9,200 Shelter 12,700 Utilities 4,200 Household O,F, and S 3,000 Transportation 12,200 Child Clothing 1,000 Adult Clothing 2,000 Child Care 2,000 Tobacco and Alcohol 800 Entertainment 4,000 Personal Care 700 Reading 200 Education 1,700 Medical Spending 3,000 Personal Insurance 700 Miscellaneous,Cash Contributions 3,000 Total $60,400 Smith Family of Four Allocation to Children Survey USDA $3,740 $3,962 4,800 6,350 1,814 2,100 890 1,500 2,623 3,600 1,000 1,000 0 0 2,000 2,000 0 0 2,040 2,000 282 350 72 100 1,620 1,700 1,544 1,277 76 0 70 0 Total $22,571 $25,939 37.4% 42.9%
Average Percentage Spent on Children by Number of Children and Total Spending of Family
Average vs Marginal • 44% of the budget is based upon a per capita allocation of the family spending to the children • Should the amount of spending on a child reflect the average (per capita) spending or the marginal spending on a spending category? • Housing: Assume that a family with one child spends $12,000 on housing. Was spending on the child equal to $4,000 or the additional spending on housing that the couple made when they had the child?
Predicting Spending • Marginal Housing Costs = Housing Expenditures with one children - Housing Expenditure if no children • To predict the couple’s housing spending if they didn’t have children, you would want to hold constant the level of total spending: Housing Spending = f(A,K, Total Spending) • Problem: Couples with the same level of total spending but with no children are better off than the family with children. Better off families spend more on housing hence the above procedure would understate the marginal spending on children.
Mark Rogers • Uses a modified USDA approach to estimate spending on children • The modification reflects his attempt to compute the marginal spending amounts to spending categories that the USDA employs a per capita allocation -- predominately housing.
Indirect Methods If we had an empirical measure or indicator of the well being of the family that systematically varied with the level of total spending and across different types of family types, we could determine the marginal economic cost of a child by • Estimate the relationship between the measure of well being and the total spending for different family sizes and compositions • For a family with a given number of children, determine their level of well being given their total spending, TSC, using the estimated relationship • Determine the level of total spending, TSo, that a couple without children would need so that their level of well being was identical to the family with C children • The amount of spending on the children would equal TSC-TSo
As families become wealthier, they spend a smaller share of their spending on food. Families with children are ‘poorer’ than families without children hence families with children will spend more on food holding total spending constant. If the food share is a reasonable indicator of family well being then we can estimate the marginal cost of children by comparing the level of total spending between families with and without children needed to maintain the same food share. Share of Spending on Food Total Spending Engel FS One Child Spending on Child No Children TSo TS1
Comments • Gorman showed that for the Engel approach to be correct, the economies of scale in consumption in all goods had to be the same as scale economies as in food consumption. • Deaton and Paxson provided both theoretical and empirical evidence against the Engel approach. • From my analysis (2000 Report) of CEX data (1996-8): Number of children: 1 2 3 Engel 30.1% 43.9% 52.0% USDA 30.4% 44.9% 53.5%
As families become wealthier, the adults spend more on themselves. Families with children are ‘poorer’ than couples without children even if they have the same level of total spending they will spend less on adult goods. If spending on themselves indicates the level of well being of the adults, the Rothbarth approach asks what level of total spending would yield the same level of spending on adults if the couple didn’t have children. Spending on Adult Goods Total Spending Rothbarth No Children One Child AG Spending on Child TSo TS1
Other Approaches • My 1990 Report examine other approaches: ISO-Prop (a bundle of necessities more than just food) and Gorman-Barten (specific utility function is assumed) • The hope would be the method by which we estimate the cost of children would not affect the estimate. This hope was not realized. • The precision by which we can estimate the proportion of total spending devoted to the children is roughly ± 3 percentage points for the average family.
Critiques of Rothbarth • Mark Rogers: for the Rothbarth estimate to be an underestimate, it must be assumed • Parents don’t like sharing with their children • Parents get no sense of well-being from their children • Income and Substitution Effects of Children • As the number of children rises, child goods and shared goods become more expensive relative to adult goods
Income and Cross Price Effect Combined Under or Over Estimate? Adult Goods No Children Complements With Children Substitutes TS1 Total Spending
Changes over Time • If we replicate the same methodologies on data collected at different points in time, will we get the same answer each time? • We would expect the estimates to differ because of • Sampling ‘Error’ or variation • Spending patterns change over time
Has Spending Changed? • Over time, I have detected that • Rothbarth estimates of spending on children have risen for the average family • The relationship between spending on children and the total spending by family has grown ‘flatter’ • I haven’t been able to determine whether this change is reflective of actual changes in behavior or is a statistical artifact of the data
Next Session Data: Consumer Expenditure Survey How do we choose an Economic Table?