Spending
Spending. I. Where the money is spent (2010 figures):. A. Medicare & Medicaid: 23% B. Social Security: 20% C. Net Interest payments: 6% D. Defense: 20% E. Other Mandatory Spending: 12% F. Discretionary Spending (negotiated between Congress and Pres annually) : 19%

Spending
E N D
Presentation Transcript
I. Where the money is spent (2010 figures): A. Medicare & Medicaid: 23% B. Social Security: 20% C. Net Interest payments: 6% D. Defense: 20% E. Other Mandatory Spending: 12% F. Discretionary Spending (negotiated between Congress and Pres annually): 19% G. Where the money is spent historically. H. Bar Graph of US Government spending I. See a pie chart of 2010 U.S. government spending: (Some of the numbers above combine the more specifically broken down categories on the following slide).
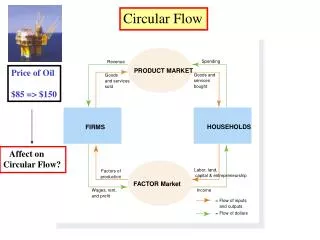
II. The problem of entitlements. A. Entitlements are federal money that is provided to those who meet eligibility requirements, and is automatically spent each year without congressional review. B. Examples: Social Security, Medicare, federal pensions, interest on national debt. C. These normally account for about 2/3 of the federal budget and make it very difficult to balance the budget. III. The Budget Process A. Executive Branch 1. Agencies prepare their estimates of budget needs and present them to the OMB. The amount requested is typically based upon the amount granted in the previous year (plus inflation and any additional needs) . 2. The OMB reviews these requests and makes recommendations to the President. 3. The President reviews the OMB recommendations and then submits a budget to Congress.
B. Congress. 1. The Congressional Budget Office provides an independent analysis of the president’s budget. This acts as a check on the OMB. 2. Congressional committees: Budget, Ways and Means, Appropriations Committees. 3. Input and lobbying from agencies. 4. Majority vote needed in both houses. 5. The Government Accountability Office (GAO) is a congressional watchdog agency that ensures the money is spent as prescribed by law.
C. Political influences. 1. Political party differences. 2. Interest group/PAC influence. 3. Iron triangles. 4. Public opinion. D. Presidential action. 1. President signs or vetoes the entire bill—no line item veto. 2. Congress can override a veto with 2/3 vote in both houses.
IV. Deficit-spending. A. Budget deficit: these occur when government expenditures exceed income during a one year period. B. National debt: an accumulation of past budget deficits. C. Huge budget deficits during the 1980’s (>$200 billion per year) ---> national debt tripled From $1 trillion to $3 trillion during the 1980’s. Tax cuts and increases in defense spending were among the main causes. D. In 1990, Congress and Bush agreed on a pay-as-you-go proposal that would allow Congress to increase spending only if that increase was offset by higher taxes and/or spending cuts elsewhere. The pay-as-you-go agreement expired in 2002. E. The government shutdown in mid-90s as a result of budgetary politics.
F. Current national debt (2010): now exceeds $10 Trillion . Until 2002, as a percentage of Gross Domestic Product, the national debt was less than it was in the early 1950s. That is no longer true. G. Failure of Congress to pass the Balanced Budget Amendment. H. Reduction of deficits under Clinton and development of surpluses led to political differences over what to do with these surpluses: Republicans favored tax cuts, Democrats wanted to apply the surpluses to the Social Security System to bolster it. I. George W. Bush $1.36 trillion tax cut in 2001, recession, terrorist attacks of 9/11, wars in Afghanistan and Iraq, and the end of pay-as-you-go ended budget surpluses in 2002. J. This has led to the resumption of budget deficits and the increased dependence on foreign lenders. V. The National Debt vs. the Deficit