Analyzing Transportation Logistics and Emissions for Greenland's Summit Station
190 likes | 305 Views
This project investigates the long-term economic viability of supply logistics for Summit Station, Greenland. We assess energy and emissions associated with varying transportation modes, including military and commercial airlift solutions, as well as oversnow traverse options. Key objectives involve minimizing costs and emissions through optimization models. Our model includes thorough metrics such as cargo and personnel movement, fuel consumption, and annual researcher days supported. Current results highlight the potential for renewable energy integration and future actions focus on model calibration to enhance decision-making tools.

Analyzing Transportation Logistics and Emissions for Greenland's Summit Station
E N D
Presentation Transcript
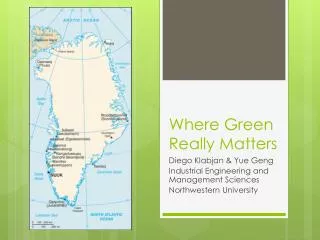
Where Green Really Matters Diego Klabjan & Yue Geng Industrial Engineering and Management Sciences Northwestern University
Agenda • Project overview • Model • Energy and emission aspects • Current results • Future actions
Project Overview Scope Features Objectives
Scope • Assess long term economical viability of Summit • Supporting transportation logistics needs • Operational considerations at Summit • Energy requirements • Environmental impact • Emissions from transportation • Renewable on-site generation
The Greenland Physics Problem • THE KEY RESOURCE QUESTIONS • How much does it cost? • How much will the cost escalate? • How can we use less of it? • PRIMARY NODES • Kangerlussuaq • Summit Station • Thule Air Base • Remote Sites… Field • KEY METRICS • Pounds of cargo moved (O-D) • Number of Pax moved (O-D) • Hourly airlift costs • Ship costs per pound • Volume of fuel consumed for flights and infrastructure • Annual researcher days supported • Energy consumption at Summit • ON-ISLAND MODES • Military airlift (LC-130) • Commercial air (Twin Otter, Helos, ?) • Oversnow Traverse Field
Features • Highly seasonal demand • Long planning period – over 5 years or more • Different modes of transportation are available • Emission should be controlled • Different emission factors for different modes of transportation • Transportation of fuel • Renewable on-site generation
Objectives • A tool to analyze scenarios • Cost • Emissions • Other key performance indicators • Given a possible scenario • Determine by means of optimization logistics requirements and expenses • Trade-off between cost and emissions
Model Network flow model Calibration
Network flow model • Standard time based model • Keeping track of fuel consumption at Summit • Base fuel consumption plus fuel consumed by people
Time (Days/Weeks) LC-130 from Scotia on day 8 arrive Kanger on day 9 Inventory left from previous day Vessel from VA Beach on day 2 arriving to Kanger on day 32 Time window for shipment A at origin Shipment A Location in the US 1 2 3 4 5 6 7 8 31 32 … … 1 2 3 4 5 6 7 8 31 32 … … Kanger 1 2 3 4 5 6 7 8 31 32 … … Summit … Time window for shipment A at destination Locations Aggregate by week Shipment A
Constraints • Flow balance for each commodity at each node • Consumable commodity • Non-consumable commodity • Capacity is not exceeded for each arc and each transportation mode • Inventory capacity is not exceeded at specific nodes • Certain matchup of commodity and transportation mode is forbidden
Energy and Emission Aspect Background on transportation emission Features Methods
Methods – Bi-level Goal Programming • Phase 1 • Minimize cost • Constraints are imposed on the constructed network • Phase 2 • Minimize emissions • Constraints are imposed on the constructed network • Cost ≤ (1+f)∙ optimal cost from Phase 1 • Control tractability by aggregation • During season aggregate by week • Off-season by month
Size of the Model • Before aggregation of demand, thousands of commodities • After aggregation of demand • Around 150 commodities • Over 3, 000 arcs • Over 30, 000 variables • Over 10, 000 constraints
Future Actions • Calibrate the model based on data from more years • Develop decomposition algorithms to handle the long planning horizon • Handling possible future scenarios • Develop the decision support tool with the above ingredients