Download
1 / 26
260 likes | 367 Views
Voices of the Hungry. A worldwide survey of people’s experience with food insecurity. Background & Motivation. FAO has the mandate to monitor progress towards the achievement of the hunger target of MDG 1 and the WFS target

E N D
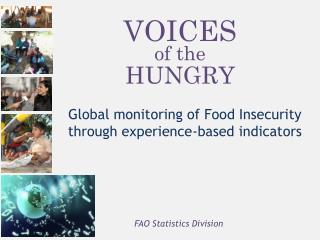
Voices of the Hungry A worldwide survey of people’s experience with food insecurity
Background & Motivation • FAO has the mandate to monitor progress towards the achievement of the hunger target of MDG 1 and the WFS target • Prevalence of Undernourishment (PoU) as a measure of the extent of chronic food deprivation (Official MDG Ind. 1.9) • FAO food security monitoring: a long history ... • World FoodSurveys (1946, 1952, 1963, 1977, 1987, 1996) • The State ofFoodInsecurity in the World (1999 - 2013) • ... alwaysdebated • FAO International Symposium 2002 • CFS Round Table 2011 • Yetanother FAO International Symposium 2012
Background & Motivation • Monitoring food security worldwide is a challenge: • Food security is a multidimensional phenomenon: multiple indicators required • Lack of a global standard: over 200 indicators proposed • Trade off between “best” operational definition of food insecurity and feasibility/sustainability of the data collection • Global monitoring: need for comparable data across countries on an annual basis with limited time lag • National monitoring: need for disaggregated data to identify vulnerable groups and vulnerable areas as well as possible determinants in order to support policy interventions (annual monitoring not needed and too costly)
The Prevalence of Undernourishment (PoU) MDG 1.9 = Proportion of population below minimum level of dietary energy consumption • Probabilistic model referred to a representative consumer: Probability that a randomly selected individual regularly consumes an amount of calories insufficient for conducting an active and healthy life • Main limitations: very complex to calculate; narrow concept of inadequate food access (calories); not measuring short-term crises; only available at national level • Not based on a headcount as the poverty rate: individual energy requirements are virtually unobservable • Mistakenly described as an indicator of food supply only: combining information on food availability and food access at the macro and micro level
Background & Motivation Other indicators are also problematic: • Children underweight/stunted • Multiple causes, not only food insecurity (e.g. diseases and infections) • South East Asia paradox (prevalence higher than in SS Africa) • Information only on one segment of the population • Similar problems of timeliness • Additional problems of coverage • IFPRI Global Hunger Index: • It is plagued by the same problems of the individual indicators on which it is based (PoU, Child underweight, Child mortality) • Aggregates different indicators with no clear rationale for the aggregation function
Background & Motivation • Need to improve our ability to monitor food insecurity at the global and national level • Food security and nutrition has taken center stage in the Post 2015 development agenda • The UN S.G. launched already the “Zero Hunger” challenge (5 targets) FAO response • Revise its methodology for estimating the PoU • Develop a suite of indicators to monitor the 4 dimensions of food security (availability, access, utilization, stability) => CFS mandate • The Voices of the Hungry project: a new metric system for monitoring food access, one of the dimensions of food security for which indicators are largely missing
VoH project: Main Benefits • Measure the inability to access adequate food in terms of quantity and quality (and the associated “welfare”) • Identify various degrees of food insecurity experiences (mild, moderate, or severe); • Assess food insecurity experiences at the individual level, thus allowing proper analysis of gender related food insecurity disparities; • Indicator based on sound methodology (Item-Response Theory) • Ensure timely monitoring of the prevalence of people experiencing food insecurity for all developing countries in the world on an annual basis • A leading indicator of potential malnutrition outcomes (link to the SUN initiative)
A new approach started in the 1990s • Dr. Kathy L. Radimer’s Ph.D. dissertation: “Understanding Hunger and Developing Indicators to Assess It”, Cornell University, August 1990 “The lack of an operational definition for hunger has been frequently cited as a barrier to progress in addressing the problem.” “Three scales, one each for household, women’s, and children’s hunger, emerged and were found to be valid and reliable indicators for measuring hunger directly” (Radimer et al., 1992) • Establishes the concept of food insecurity as an experiential construct
The food insecurity experience scale (FIES) • The severity of the constraints in accessing food is reflected in typical experiences: • People start being worried about how to get food and thinking of giving up other expenses; • Then limit the variety/quality; • Then will start reducing quantities (cutting portions, skipping meals) • Eventually will reach the point of being exposed to hunger • Different levels of severity have different consequences: • Mild food security - > welfare reduction due to reduction of other consumption (education, health insurance, etc) • Moderate food insecurity - > bad quality of food, unbalanced diets, various forms of malnutrition, including obesity and other NCD • Severe food insecurity - > undernourishment and hunger
The food insecurity experience scale (FIES) The FIES: a set of questions spanning the range of experiences Food security Food insecurity mild moderate severe Worries Compromising food quality and variety Compromising food quantity Hunger experiences Wellbeing Welfare reduction(Psychological costs, reduction of other essential expenses) Malnutrition(obesity, micronutrient deficiencies, reduced work capacity) Undernutrition (stunting, wasting) Starvation consequences
The (current version of the) FIES “During the last 12 months, was there a time when, because of lack of money or other resources: • You were worried you could not get enough food to eat? • You were unable to eat healthy and nutritious food? • You ate only a few kinds of foods? • You had to skip a meal? • You ate less than you thought you should? • Your household ran out of food? • You were hungry but did not eat? • You went without eating for a whole day?”
The (current version of the) FIES “During the last 12 months, was there a time when, because of lack of money or other resources: • You were worried you could not get enough food to eat? • You were unable to eat healthy and nutritious food? • You ate only a few kinds of foods? • You had to skip a meal? • You ate less than you thought you should? • Your household ran out of food? • You were hungrybut did not eat? • You went without eating for a whole day?” The qualifier is important, to make sure experiences refer to food insecurity andnot to other possible reasons(health, culture, normal seasonality, etc.)
The (current version of the) FIES “During the last 12 months, was there a time when, because of lack of money or other resources: • You were worried you could not get enough food to eat? • You were unable to eat healthy and nutritious food? • You ate only a few kinds of foods? • You had to skip a meal? • You ate less than you thought you should? • Your household ran out of food? • You were hungry but did not eat? • You went without eating for a whole day?” Can be adapted to shorter reference periods, when the survey is repeated over different seasons/periods to explore shorter term dynamics in food insecurity.
The (current version of the) FIES “During the last 12 months, was there a time when, because of lack of money or other resources: • Youwere worried you could not get enough food to eat? • Youwere unable to eat healthy and nutritious food? • Youate only a few kinds of foods? • Youhad to skip a meal? • Youate less than you thought you should? • Your household ran out of food? • Youwere hungry but did not eat? • Youwent without eating for a whole day?” When households are sampled, instead of individuals, it can be adapted to refer to the household (ex. “you or any other member of your household”). Care should be given to select the most appropriate respondent.
The (current version of the) FIES “During the last 12 months, was there a time when, because of lack of money or other resources: • You were worried you could not get enough food to eat? • You were unable to eat healthy and nutritious food? • You ate only a few kinds of foods? • You had to skip a meal? • You ate less than you thought you should? • Your household ran out of food? • You were hungrybut did not eat? • You went without eating for a whole day?” Even though some of the questions include possibly subjective elements, the scale aims at constructing an objective measure of the severity of the constraints faced in accessing food.
The tool • It is based on the concepts that: • Experiences can be ranked in terms of severity from the least severe (just being worried) to the most severe (suffering from hunger) • The more food insecure one is, the more likely it is that he or she will report having suffered from the “worst” experiences • It uses a long established probabilistic model (the Rasch measurement model) to estimate the severity of the situation revealed by each experience, and by each respondent • The individual measure of severity depends on the entire pattern of responses (not on any single answer considered in isolation!)
The analytics • Given a set of responses (Yes = 1, No = 0) to the eight questions, the item severity parameters and the person parameters can be estimated by Maximum Likelihood procedures. • The person parameters are then used to classify respondents into one of three classes: food secure, moderately food insecure and severely food insecure • The relative frequency of each class in the sample is used as an estimator of the prevalence of that class of food insecurity severity in the population • When data are available from different countries or different samples, the scores can be standardized to ensure comparability of the measurement
Empirical testing of the results • The theory allows for testing whether or not each of the question is contributing to the measurement • Once items are ranked by increasing severity, expected patterns are of the form {1,..,1, 0, …, 0} (affirming one item implies affirming also all the less severe ones) • By comparing the probability associated with each observed pattern with the expected probability of the theoretically consistent pattern for the same raw score, an ‘error’ or ‘residual’ can be estimated • Methods developed in the educational testing practice allow to map the scores obtained with different tests (sets of items) on the same, common underlying scale of severity • Measures of severity obtained in different countries can be made comparable even if not all items have the same associated severity in each country • Solution to the problem found by Coates et al. for the HFIAS
VoH: the implementation • Pilot tested in Angola, Ethiopia, Malawi and Niger in 2013 • Validate the feasibility of the data collection tool • Evaluate the robustness of the scale items and refine some of them • Defining the analytic protocol for scale calibration and equalization and to set the thresholds • FIES included as a module in the Gallup World Poll (GWP) starting from 2014, during a calendar covering March – November • The GWP is a worldwide survey of nationally representative samples of the adult population (15+) conducted annually in 150+ countries • The first set of results will be available in August, allowing us to define the global standard reference for scale calibration and to set the thresholds for classification • Micro data from the FIES questionnaire will be made publicly available, together with a number of socio-demographic covariates • Licenses to the entire GWP dataset will be awarded to partner research institution to conduct research on Food Security against many other social and political conditions in the countries
VoH: Objectives • To establish a worldwide valid standard for measuring the severity of food insecurity • To estimate the prevalence of moderate and of severe food insecurity in 150+ countries in 2014 and 2015, to set a benchmark against which to monitor progress at national level • To make available to any interested user linguistically and culturally adapted versions of the questionnaire in more than 200 languages • To promote adoption of the FIES in national food security monitoring systems (inclusion of the module in national household surveys)
VoH: Current partnership • Resource partners • DfID, Government of Belgium • Scientific Advisory group • Angus Deaton, Lawrence Haddad, Romulo Paes de Sousa, Mark Nord, Hugo Melgar-Quinonez • ESS Team • Pietro Gennari, Carlo Cafiero, Terri Ballard, Mauro Del Grossi, Anne Kepple, Sara Viviani, Aymeric Songy, Verena Wilke • Friends/Collaborators • Ana Maria Segal-Correa, Rafael Perez-Escamilla, Jennifer Coates
VoH: possible partnerships • Collaborating with professionals from all over the world to conduct linguistic and cultural adaptation of the FIES • Collaboration with National Statistical Offices to promote use of the FIES in any survey that covers households or individuals in the country • Introduction of the FIES into any national and international Food Security Information System • Explore synergies with other existing food security monitoring tools • ELCSA, EBIA, CSI • Promote the use of the FIES as a tool for impact analysis of policies that are intended to promote food security and nutrition • Promote use of FAO’s VoH indicators in the Post 2015 Development Agenda new monitoring framework
Need for further support • Current plan is to collect data through the GWP for five years • Overall budget of about 18 million USD. Resources have been mobilized to cover the first two years • Need to mobilize additional funding to cover 2016-2018 • Complete the project’s staffing • Deploying the capacity development activity to promote wide use of the tool
Selected references • Michelle Hackett, Hugo Melgar-Quiñonez, Christopher A. Taylor, Martha Cecilia ÁlvarezUribe. Factors associated with household food security of participants of the MANA food supplement program in Colombia. Archivoslatinoamericanos de nutrición 2010; 6(1) 42-47 • Hackett M, Melgar-Quiñonez H, Álvarez MC. Household food insecurity associated with stunting and underweight among preschool children in Antioquia, Colombia. Rev PanamSaludPública. 2009;25(6):506-510. • Álvarez, MC, Estrada Alejandro. Seguridadalimentaria de los hogarescolombianossegúnlocalizacióngeográfica y algunascondicionessociodemográficos. RevistaPerspectiva de Nutrición Humana. 2008:10(1):37-50 • Hackett M, Melgar-Quinonez H, Alvares MC. Internal validity of a household security scale es consistent among diverse populations participating in a food supplement program in Colombia. BMC Public Health. 2008, 8:175 • Pérez-Escamilla, R, Melgar-Quiñonez, H, Nord, M, Álvarez, MC, Segall-Correa, AM. Análisiscomparativo entre ítems de lasescalas de seguridadalimentariausadas en Brasil (PNAD 2004) y Colombia (ENSIN 2005). • Perspectivas de Nutrición Humana. SeparataMemorias de la 1 Conferencia en América Latina y el Caribesobre la medición de la seguridadalimentaria. 2007: 103-12. • Álvarez, MC. La experienciacolombiana en la adaptación y validación de la Escala de SeguridadAlimentaria. Perspectivas de Nutrición Humana. SeparataMemorias de la 1 Conferencia en América Latina y el Caribesobre la medición de la seguridadalimentaria. 2007: 77-87. • Álvarez, MC. SeguridadAlimentaria en los hogarescolombianos. En: Encuestanacionalsobre la situaciónnutricional en Colombia. Bogotá 2007:319-335. ISBN 978-958-623-087-2. • Álvarez, MC, Estrada Alejandro, Melgar-Quiñonez. Validación de escala de seguridadalimentariadoméstica en Antioquia, Colombia. Rev SaludPública de México. 2006;48:474-481.
“Voices of the Hungry” Thank you for your attention! PietroGennari, ESS Voices-of-the-Hungry@FAO.org