CLUSTER VALIDITY
Before applying clustering algorithms, it is crucial to verify whether the data set has a clustering structure, known as clustering tendency. This involves hypothesis testing against randomness, regularity, and clustering hypotheses. If the data shows clustering tendency, cluster validity evaluation follows to assess clustering results through external, internal, and relative criteria. Statistical methods are pivotal in determining the effectiveness of clustering and ensuring that interpretation of data leads to accurate insights. Proper validation prevents misleading outcomes from poorly parameterized algorithms.

CLUSTER VALIDITY
E N D
Presentation Transcript
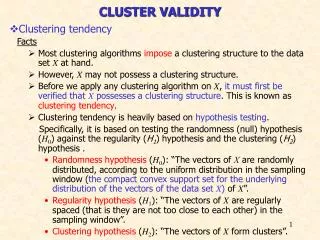
CLUSTER VALIDITY • Clustering tendency Facts • Most clustering algorithms impose a clustering structure to the data set X at hand. • However, X may not possess a clustering structure. • Before we apply any clustering algorithm on X, it must first be verified that X possesses a clustering structure. This is known as clustering tendency. • Clustering tendency is heavily based on hypothesis testing. Specifically, it is based on testing the randomness (null) hypothesis (H0) against the regularity (H1) hypothesis and the clustering (H2) hypothesis . • Randomness hypothesis (H0): “The vectors of Χare randomly distributed, according to the uniform distribution in the sampling window (the compact convex support set for the underlying distribution of the vectors of the data set X) of X”. • Regularity hypothesis (H1): “The vectors of X are regularly spaced (that is they are not too close to each other) in the sampling window”. • Clustering hypothesis (H2): “The vectors of X form clusters”.
p(q|H0), p(q|H1) and p(q|H2) are estimated via Monte Carlo simulations Some tests for spatial randomness, when the input space dimensionality greater than or equal to 2 are: • Tests based on structural graphs • Test that utilizes the idea of the minimum spanning tree (MST) • Tests based on nearest neighbor distances • The Hopkins test • The Cox-Lewis test • A method based on sparse decomposition.
Important notes: • Clustering algorithms should be applied on X, only if the randomness and the regularity hypotheses are rejected. Otherwise, methods different than clustering must be used to describe the structure of X. • Most studies in clustering tendency focus on the detection of compact clusters. • The basic steps of the clustering tendency philosophy are: • Definition of a test statistic q suitable for the detection of clustering tendency. • Estimation of the pdf of q under the null (H0) hypothesis, p(q|H0). • Estimation of p(q|H1)and p(q|H2) (they are necessary for measuring the power of q (the probability of making a correct decision when H0 is rejected) against the regularity and the clustering tendency hypotheses). • Evaluation of q for the data set at hand, X, and examination whether it lies in the critical interval of p(q|H0), which corresponds to a predetermined significance level ρ.
Cluster validity • In the sequel it is assumed that the clustering tendency procedure indicated the existence of a clustering structure in X. • Applying a clustering algorithm on X, with inappropriate values of the involved parameters, poor results may be obtained.Hence the need for further evaluation of clustering results is apparent. • Cluster validity: a task that evaluates quantitatively the results of a clustering algorithm. • A clustering structure C, resulting from an algorithm may be either • A hierarchy of clusterings or • A single clustering.
Cluster validity may be approached in three possible directions: • C is evaluated in terms of an independently drawn structure, imposed on Xa priori. The criteria used in this case are called external criteria. • C is evaluated in terms of quantities that involve the vectors of X themselves (e.g., proximity matrix). The criteria used in this case are called internal criteria. • C is evaluated by comparing it with other clustering structures, resulting from the application of the same clustering algorithm but with different parameter values, or other clustering algorithms, on X. Criteria of this kind are called relative criteria.
Cluster validity for the cases of external and internal criteria • Hypothesis testing is employed. • The null hypothesis H0, which is a statement of randomness concerning the structure of X, is defined. • The generation of a reference data population under the random hypothesis takes place. • An appropriate statistic, q, whose values are indicative of the structure of a data set, is defined. The value of q that results from our data set X is compared against the values obtained for q when the elements of the reference (random) population are considered. Ways for generating reference populations under the null hypothesis (each one used in different situations): • Random position hypothesis. • Random graph hypothesis. • Random label hypothesis.
Statistics suitable for external criteria • For the comparison of C with an independently drawn partition P of X • Rand statistic • Jaccard statistic • Fowlkes-Mallows index • Hubert’s Γ statistic • Normalized Γ statistic • For assessing the agreement between P and the proximity matrix P. • Γ statistic. • Statistics suitable for internal criteria • Validation of hierarchy of clusterings • Cophenetic correlation coefficient (CPCC) • γ statistic • Kudall’s τ statistic. • Validation of individual clusterings • Γ statistic • Normalized Γ statistic
Cluster validity for the cases of relative criteria Let A denote the set of parameters of a clustering algorithm. Statement of the problem • “Among the clusterings produced by a specific clustering algorithm, for different values of the parameters in A, choose the one that best fits the data set X”. We consider two cases • Adoes not contain the number of clusters m. The estimation of the best set of parameter values is carried out as follows: • Run the algorithm for a wide range of values of its parameters. • Plot the number of clusters, m, versus the parameters of A. • Choose the widest range for which m remains constant. • Adopt the clustering that corresponds to the values of the parameters in A that lie in the middle of this range.
(b) Adoes contain the number of clusters m. The estimation of the best set of parameter values is carried out as follows: • Select a suitable performance index q (the best clustering is identified in terms of q). • For m=mmin to mmax • Run the algorithm r times using different sets of values for the other parameters of A and each time compute q. • Choose the clustering that corresponds to the best q. • End for • Plot the best values of q for each m versus m. • The presence of a significant knee indicates the number of clusters underlying X. Adopt the clustering that corresponds to that knee. • The absence of such a knee indicates that X possesses no clustering structure.
Statistics suitable for relative criteria • Hard clustering • Modified Hubert Γ statistic • Dunn and Dunn-like indices • Davies-Bouldin (DB) and DB-like indices • Fuzzy clustering • Indices for clusters with point representatives • Partition coefficient (PC) • Partition entropy coefficient (PE) • Xie-Beni (XB) index • Fukuyama-Sugeno index • Total fuzzy hypervolume • Average partition density • Partition density
Statistics suitable for relative criteria (cont.) • Fuzzy clustering (cont.) • Indices for shell-shaped clusters • Fuzzy shell density • Average partition shell density • Shell partition density • Total fuzzy average shell thickness