Download
1 / 35
420 likes | 581 Views
Learn about USDA soil classifications, bulk density, water content, texture, soil hydraulic properties, and water-holding capacity in agricultural soils. Explore the impact of soil texture on water flow and plant viability.

E N D
Soil Properties • Texture • Definition: relative proportions of various sizes of individual soil particles • USDA classifications • Sand: 0.05 – 2.0 mm • Silt: 0.002 - 0.05 mm • Clay: <0.002 mm • Textural triangle: USDA Textural Classes • Coarse vs. Fine, Light vs. Heavy • Affects water movement and storage • Structure • Definition: how soil particles are grouped or arranged • Affects root penetration and water intake and movement
Bulk Density (b) • b = soil bulk density, g/cm3 • Ms = mass of dry soil, g • Vb = volume of soil sample, cm3 • Typical values: 1.1 - 1.6 g/cm3 • Particle Density (p) • P = soil particle density, g/cm3 • Ms = mass of dry soil, g • Vs = volume of solids, cm3 • Typical values: 2.6 - 2.7 g/cm3
Porosity () • Typical values: 30 - 60%
Water in Soils • Soil water content • Mass water content (m) • m = mass water content (fraction) • Mw = mass of water evaporated, g (24 hours @ 105oC) • Ms = mass of dry soil, g
Volumetric water content (v) • V = volumetric water content (fraction) • Vw = volume of water • Vb = volume of soil sample • At saturation, V = • V = As m • As = apparent soil specific gravity = b/w (w = density of water = 1 g/cm3) • As = b numerically when units of g/cm3 are used • Equivalent depth of water (d) • d = volume of water per unit land area = (v A L) / A = v L • d = equivalent depth of water in a soil layer • L = depth (thickness) of the soil layer
Volumetric Water Content & Equivalent Depth (cm3) Equivalent Depth (cm3) (g) (g)
Volumetric Water Content & Equivalent DepthTypical Values for Agricultural Soils Soil Solids (Particles): 50% 0.50 in. 1 in. Very Large Pores: 15% (Gravitational Water) 0.15 in. Total Pore Space: 50% Medium-sized Pores: 20% (Plant Available Water) 0.20 in. Very Small Pores: 15% (Unavailable Water) 0.15 in.
Water-Holding Capacity of SoilEffect of Soil Texture Coarse Sand Silty Clay Loam Dry Soil Gravitational Water Water Holding Capacity Available Water Unavailable Water
Soil Water Potential • Description • Measure of the energy status of the soil water • Important because it reflects how hard plants must work to extract water • Units of measure are normally bars or atmospheres • Soil water potentials are negative pressures (tension or suction) • Water flows from a higher (less negative) potential to a lower (more negative) potential
Soil Water Potential • Components • t = total soil water potential • g = gravitational potential (force of gravity pulling on the water) • m = matric potential (force placed on the water by the soil matrix – soil water “tension”) • o = osmotic potential (due to the difference in salt concentration across a semi-permeable membrane, such as a plant root) • Matric potential, m, normally has the greatest effect on release of water from soil to plants
Soil Water Release Curve • Curve of matric potential (tension) vs. water content • Less water more tension • At a given tension, finer-textured soils retain more water (larger number of small pores)
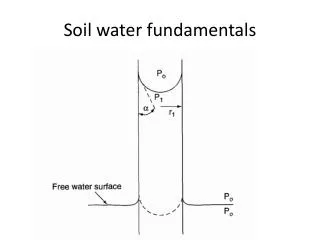
Matric Potential and Soil Texture The tension or suction created by small capillary tubes (small soil pores) is greater that that created by large tubes (large soil pores). At any given matric potential coarse soils hold less water than fine-textured soils. Height of capillary rise inversely related to tube diameter
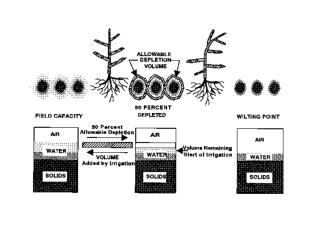
Field Capacity (FC or fc) • Soil water content where gravity drainage becomes negligible • Soil is not saturated but still a very wet condition • Traditionally defined as the water content corresponding to a soil water potential of -1/10 to -1/3 bar • Permanent Wilting Point (WP orwp) • Soil water content beyond which plants cannot recover from water stress (dead) • Still some water in the soil but not enough to be of use to plants • Traditionally defined as the water content corresponding to -15 bars of SWP
Available Water • Definition • Water held in the soil between field capacity and permanent wilting point • “Available” for plant use • Available Water Capacity (AWC) • AWC = fc - wp • Units: depth of available water per unit depth of soil, “unitless” (in/in, or mm/mm) • Measured using field or laboratory methods (described in text)
Fraction available water depleted (fd) • (fc - v) = soil water deficit (SWD) • v = current soil volumetric water content • Fraction available water remaining (fr) • (v - wp) = soil water balance (SWB)
Total Available Water (TAW) TAW = (AWC) (Rd) • TAW = total available water capacity within the plant root zone, (inches) • AWC = available water capacity of the soil, (inches of H2O/inch of soil) • Rd = depth of the plant root zone, (inches) • If different soil layers have different AWC’s, need to sum up the layer-by-layer TAW’s TAW = (AWC1) (L1) + (AWC2) (L2) + . . . (AWCN) (LN) - L = thickness of soil layer, (inches) -1, 2, N: subscripts represent each successive soil layer [Error on page 26 of text: change SWD TAW ]
Gravity vs. Capillarity Horizontal movement due to capillarity Vertical movement due largely to gravity
Water InfiltrationDef’n.: the entry of water into the soil Influencing Factors • Soil texture • Initial soil water content • Surface sealing (structure, etc.) • Soil cracking • Tillage practices • Method of application (e.g., Basin vs. Furrow) • Water temperature
Cumulative Infiltration Depth vs. Time For Different Soil Textures
Infiltration Rate vs. Time For Different Soil Textures
Soil Infiltration Rate vs. Constant Irrigation Application Rate
Soil Infiltration Rate vs. Variable Irrigation Application Rate
Depth of Penetration • Can be viewed as sequentially filling the soil profile in layers • Deep percolation: water penetrating deeper than the bottom of the root zone • Leaching: transport of chemicals from the root zone due to deep percolation
Gravimetric Measures mass water content (m) Take field samples weigh oven dry weigh Advantages: accurate; Multiple locations Disadvantages: labor; Time delay Feel and appearance Take field samples and feel them by hand Advantages: low cost; Multiple locations Disadvantages: experience required; Not highly accurate Soil Water Measurement
Soil Water Measurement • Neutron scattering (attenuation) • Measures volumetric water content (v) • Attenuation of high-energy neutrons by hydrogen nucleus • Advantages: • samples a relatively large soil sphere • repeatedly sample same site and several depths • accurate • Disadvantages: • high cost instrument • radioactive licensing and safety • not reliable for shallow measurements near the soil surface • Dielectric constant • A soil’s dielectric constant is dependent on soil moisture • Time domain reflectometry (TDR) • Frequency domain reflectometry (FDR) • Primarily used for research purposes at this time
Soil Water Measurement • Tensiometers • Measure soil water potential (tension) • Practical operating range is about 0 to 0.75 bar of tension (this can be a limitation on medium- and fine-textured soils) • Electrical resistance blocks • Measure soil water potential (tension) • Tend to work better at higher tensions (lower water contents) • Thermal dissipation blocks • Measure soil water potential (tension) • Require individual calibration
Tensiometer for Measuring Soil Water Potential Water Reservoir Variable Tube Length (12 in- 48 in) Based on Root Zone Depth Porous Ceramic Tip Vacuum Gauge (0-100 centibar)