Download
1 / 1
780 likes | 3.29k Views
ANATOMY OF THE STATISTICAL ALPHABET: Selected Symbols for Intro Statistics. M : Median MR : Midrange N : Population Size n : Sample Size r : Rho – Population Correlation p : Population Proportion P : Probability, Percentile : (p-hat) – Sample Proportion

E N D
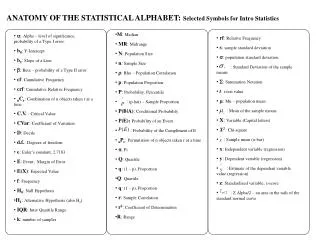
ANATOMY OF THE STATISTICAL ALPHABET: Selected Symbols for Intro Statistics • M: Median • MR: Midrange • N: Population Size • n: Sample Size • r: Rho – Population Correlation • p: Population Proportion • P: Probability, Percentile • : (p-hat) – Sample Proportion • P(B|A): Conditional Probability • P(E): Probability of an Event • : Probability of the Compliment of E • nPr: Permutation of n objects taken r at a time • p: Pi • Q: Quartile • q: (1 – p), Proportion • Q: Quartile • q: (1 – p), Proportion • r: Sample Correlation • r2: Coefficient of Determination • R: Range • a: Alpha – level of significance, probability of a Type I error. • b0: Y-Intercept • b1: Slope of a Line • b: Beta – probability of a Type II error • cf: Cumulative Frequency • crf: Cumulative Relative Frequency • nCr: Combination of n objects taken r at a time • C.V. : Critical Value • CVar: Coefficient of Variation • D: Decile • d.f.: Degrees of freedom • e: Euler’s constant, 2.7183 • E: Event; Margin of Error • E(X): Expected Value • f: Frequency • H0: Null Hypothesis • H1: Alternative Hypothesis (also Ha) • IQR: Inter Quartile Range • k: number of samples • rf: Relative Frequency • s: sample standard deviation • s: population standard deviation • : Standard Deviation of the sample means • S: Summation Notation • t: t-test value • m: Mu – population mean • : Mean of the sample means • X: Variable (Capital letters) • X2:Chi-square • : Sample mean (x-bar) • x: Independent variable (regression) • y: Dependent variable (regression) • : Estimate of the dependent variable value (regression) • z: Standardized variable; z-score • : Z Alpha/2 – an area in the tails of the standard normal curve