Download
1 / 40
400 likes | 421 Views
This document outlines the Total Maximum Daily Load (TMDL) and Implementation Plan for methylmercury in the Sacramento-San Joaquin Delta Estuary. It discusses the importance of a TMDL, TMDL elements, implementation goals, and monitoring. The plan aims to reduce methylmercury levels in water and protect humans and wildlife.

E N D
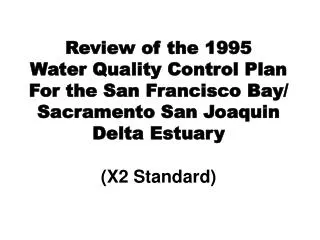
Methylmercury TMDL & Implementation Plan for theSacramento-San Joaquin RiverDelta Estuary 2006 National Monitoring Conference Michelle Wood
Outline • TMDL Primer • Why a MeHg TMDL? • The Delta MeHg TMDL
Federal Clean Water ActSection 303(d) Requires Total Maximum Daily Loads for waterways that don’t meet WQ standards even after controlling point sources
Definition of TMDL: The amount of a pollutant that a water body can receive and still meet water quality standards (assimilative capacity)
TMDL Elements • Problem statement • Numeric target • Source analysis • Linkage analysis • Allocations
A TMDLWithout Implementation:Ghost Regulation • State Porter-Cologne Water Quality Control Act • Requires Regional Boards to implement TMDLs • TMDL implementation plans are amended into State water quality plans (“Basin Plans”)
SacramentoRiver Feather R. American R. Clear Lake Cache Creek Bear Creek Harley Gulch Putah Creek Delta San Joaquin R. Central Valley Mercury TMDLs
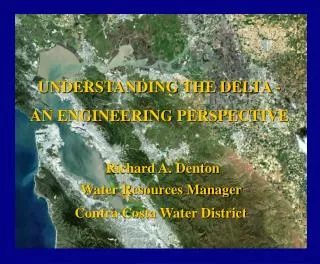
Sacramento Region 5 Region 2 San Francisco Bay Antioch Stockton Brentwood Tracy The Delta >1100 mi waterways Drains ~1/3 of CA ReduceCentral Valley Mercury Outflows by 110 Kg/yr
Methylmercury • Most toxic form of mercury (a potent neurotoxicant) • Sulfate-reducing bacteria convert mercury to MeHg • >90% mercury in top trophic level fish is MeHg • Exposure to MeHg is through consumption of fish & shellfish
1 mg/kg MeHg Bioaccumulates… Delta Water : Largemouth Bass1: 6,500,000 0.1 ng/l
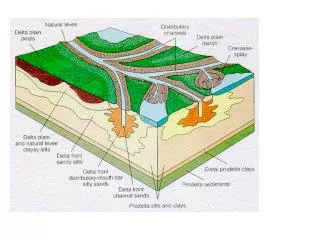
Atmospheric dep. Geothermal springs & Naturally enriched soils Urban & WWTP Urban & WWTP Wetlands Agricultural Lands / Delta Islands
Concerns about Focusing Control Program on Only Inorganic Hg • Millions of kilograms released to waterways by historic mining • Much remains in channels & may be untreatable • Necessitate reliance on natural erosion as a reduction strategy • May take centuries to wash the mercury from the waterways
Interrupt the Methylation Cycle • Identify sources of MeHg • Reduce methylation, and/or • Reduce mercury sources that supply the methylation sources • Shorten time to see fish tissue improvements from centuries to decades
Outline • TMDL Primer • Why a MeHg TMDL? • The Delta MeHg TMDL
MeHg TMDL Elements • Numeric target (a.k.a. WQO) • Source analysis • Linkage analysis • Implementation plan with Allocations • Monitoring and evaluation
Numeric Target • Protect humans and wildlife • Main factor: fish consumption rates • There are many options…
Large TL4 Fish 0.29 Wildlife Targets
Recommended Targets • Large TL4 Fish: 0.24 ppm • Humans: 1 meal/week of mixed bag • Protects piscivorous wildlife species • Small TL3 Fish: 0.03 ppm • Protects wildlife consuming small fishwhere there are no big fish to monitor Key Policy Question
MeHg Linkage • Links targets to sources using the Delta-specific mathematical relationship between water and fish MeHg concentrations • Determines a MeHg goal for ambient water
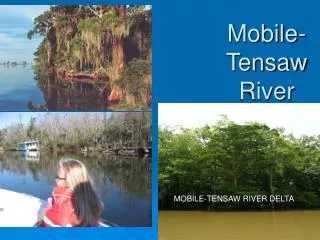
MeHg Sampling Locations Used in Linkage TL4 Fish – LMB – Water –
1.04 0.19 0.72 0.68 0.31 Large-mouthBass Lengthvs. MeHgConc. 350 mm Good method for evaluating long-term changes!
Implementation Goal for LMB Target for TL4 Fish TL4 Fish WQO & 350 mm LMB Hg Goal
Implementation Goal forAmbient Water: 0.06 ng/l as an annual average 350 mm LMB MeHg Goal & Average Annual Water MeHg Goal
RecommendedControl Program • Control MeHg sources • Control TotHg sources • Reduce MeHg exposure to the fish eating public
5-Year Study Period: • Conduct studies to characterize & control existing MeHg & Hg concentrations and loads • GOALS: • Address uncertainty in load estimates • Develop technically & economically feasible controls
33 > 0.1 ng/l 26 < 0.05 ng/l Preliminary Municipal WWTP MeHg Monitoring Results
Mercury Offset Program Enable beneficial projectsto proceed even ifon-site mercury controls are not feasible
Timeline • Within 30 years: If implement MeHg controls, achieve measurable reductionsin fish tissue mercury • 100+ years: Fully achieve WQO
Evaluate Monitor Adaptive Implementation Lower Fish MeHg Action
Next Steps • Report for scientific peer review • Release draft BPA staff report • Board Hearing in Fall/Winter 2006
AcknowledgmentsData, Methods & Ideas SFEI, UCDavis, SRWP, CMPSF Water Board staff, DHS, OEHHA, DFG,Moss Landing Marine Laboratories,USGS, USFWS ***CALFED Mercury Program***
0.92 0.56 0.26 0.57 Weighted Average MeHg Levels in TL4 Fish(mg/kg)
0.3 0.05 0.15 Average AnnualAmbient MeHg Levelsin Water(ng/l)
San Joaquin Subregion Methylmercury SourcesTotal Loading: ~478 g/yr Agri- Wastewater Other cultural 9% Tributaries Lands Inputs 77% 5% 23% Open Water Wetlands Urban 4% 4% 1%
Yolo Bypass Subregion Methylmercury SourcesTotal Loading: ~1,000 g/yr Wetlands Other 39% Tributaries Inputs 51% 49% Open Water 8% Agricultural Lands 2%