Download
1 / 21
210 likes | 296 Views
Explore the gaps in federal data indicators for early childhood and discover opportunities for improvement and expansion to inform policy decisions at state and national levels.

E N D
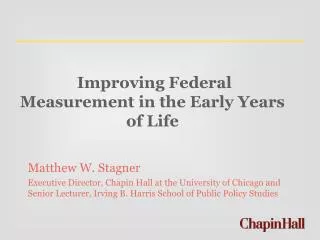
Improving Federal Measurement in the Early Years of Life Matthew W. Stagner Executive Director, Chapin Hall at the University of Chicago and Senior Lecturer, Irving B. Harris School of Public Policy Studies
Outline of the presentation • Many improvements over the past 15 years • Continuing needs • Early childhood is key • Points of opportunity in early childhood and beyond
Source of the perspectives presented Chapin Hall convened 24 academic researchers, representatives of nonprofit organizations, and government officials for an all day meeting to discuss the future of child indicators in the Federal system
Many improvements • Federal Interagency Forum on Child and Family Statistics • KIDSCOUNT • Web tools for data access: • datacenter.kidscount.org • www.childtrendsdatabank.org • www.childstats.gov
Continuing needs • Missing indicators on many things that really matter • Few existing annual national indicators • Fewer consistent state indicators • Important because early childhood policy is created at the state level
Continuing needs: Limited health indicators • Pre-term birth • 12..3% (2009) 12.2% (2009) • Low birthweight • 8.2% (2008) 8.2% (2009) • Infant mortality • 6.6 per 1,000 (2008) 6.4 per 1,000 (2009)
Continuing needs: Limited education indicators • Children ages 0–4, with employed mothers, whose primary child care arrangement is with a relative • 46% (2002) 48% (2005) • Children ages 0–6, not yet in kindergarten, who received some form of nonparental child care on a regular basis • 61% (2001) 61% (2005)
Continuing needs: Limited education indicators Family reading to young children: Percentage of children ages 3–5a who were read to every day in the last week by a family member by child and family characteristics
Continuing needs: data across states • National KIDS COUNT Key Indicators • Low-birthweight babies • Infant mortality • Child deaths • Teen deaths from all causes • Teen births by age group • Teens ages 16 to 19 not in school and not high school graduates • Teens ages 16 to 19 not attending school and not working • Children in families where no parent has full-time, year-round work • Children in poverty • Children in single-parent families
Continuing needs: sources for state data • National Survey of Children's Health • U.S. Department of Health and Human Services, Health Resources and Services Administration, Maternal and Child Health Bureau • American Community Survey • Census Bureau • These are limited in frequency or depth
What we can say at the state level • A few interesting and appetite-whetting examples . . .
Children under age 6 in family-based childcare (Percent) – 2007 Data Source: Child Trends, analysis of data from the U.S. Department of Health and Human Services, Health Resources and Services Administration, Maternal and Child Health Bureau, National Survey of Children's Health.
Children ages 1 to 5 whose family members read to them less than 3 days per week (Percent) – 2007 Data Source: Child Trends, analysis of data from the U.S. Department of Health and Human Services, Health Resources and Services Administration, Maternal and Child Health Bureau, National Survey of Children's Health.
Children ages 3 to 5 not enrolled in nursery school, preschool or kindergarten (Percent) – 2008 Data Source: Population Reference Bureau, analysis of data from the U.S. Census Bureau, American Community Survey.
Importance of early childhood Source: Heckman and LaFontaine (2007).
Continuing needs: Keeping up on new thinking about what matters Example: Socio-Emotional Learning (SEL) Definition • “The process through which we learn to recognize and manage emotions, care about others, make good decisions, behave ethically and responsibly, develop positive relationships, and avoid negative behaviors” • Zins, J.E., Bloodworth, M.R., Weissberg, R.P., and Walberg, H. (2004); Elias et al., (1997)
SEL Core Competencies • Self-awareness • Self-management • Social awareness • Relationship skills • Responsible decision-making (CASEL, 2003)
Sample Questions to Measure SEL • Has trouble concentrating • Worries a lot • Shows patience • Does not show feelings • Is afraid of new situations • Spends more time alone • Teases others • Chooses to do tasks that are challenging for him/her
Existing SEL Surveys and Tools • Devereux Early Childhood Assessment Program (DECA) • Pediatric Symptom Checklist • Behavior Assessment System for Children • Social Skills Improvement System (SSIS)
Points of Opportunity • Collect more at universal contact points: • Birth certificates • Immunization visits • School entry • New national survey with state level samples
Thank you! Matthew W. Stagner Executive Director Chapin Hall at the University of Chicago Senior Lecturer, Harris School of Public Policy Studies 1313 E. 60th St., Chicago, IL 60637 V: 773-256-5116 F: 773-753-5940 mstagner@chapinhall.org http://www.chapinhall.org