Comprehensive Overview of the Danish Soil Classification System
660 likes | 744 Views
Explore the evolution of the Danish Soil Classification from 1975 to 1990, including mapping, sampling methods, soil analysis techniques, and the organizational structure behind this initiative. Learn about the criteria for classifying soil areas, mapping techniques, and the development of soil maps in Denmark.

Comprehensive Overview of the Danish Soil Classification System
E N D
Presentation Transcript
The Danish Soil Classification • From 1939 to 1975 the farmland area dropped from 32.000 sqkm to 28.000 sqkm • It raised a need for soil maps for planning and administration purposes at national and county level • The Danish government decided to finance a national soil mapping
The Danish Soil Classification • 1975-1980: Soil mapping of the agriculture land mainly based on soil texture of the topsoil • 1980-1985: Additional soil map on subsoil texture, landform and wetland and the establishment of a Danish pedological soil analytical database • 1985-1990: Modelling and thematic maps
Basic requirements • The areas should be classified on the basis of permanent stable characteristics • There should be a national standard code of reference that would make it possible to classify as uniform as possible • The results should clearly illustrate the range of fertile and infertile soils • The maps should be made in such a way that they might be used in future regional planning • The mapping should be finished within 3 years (price app. 600.000 Euro)
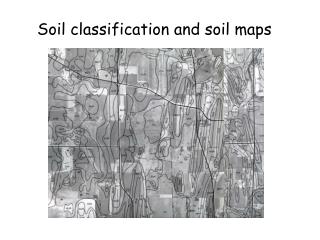
The soil map, scale 1:50.000 • Classified area • Texture of the plowlayer and subsoil (12 classes) • Slope (3 classes) • Subsoil geology (app. 50 classes) • Not classified area • Urban zone • Forest • Coastal dune sands, small arable areas, lakes etc
Organisation • In December 1975 ADK was established to undertake the soil sampling, database handling and construction of the maps at scale 1:50.000. • Crew: 3 AC and 1 technician + some students from the Universities. • The soil sampling was done by local agronomists and the soil analyses were done at a research laboratory.
Mapping slopes and surface geology Slope classes Three slope classes delineated on topographic maps at scale 1:25000 <6 degrees, 6-12 degrees and >12 degrees Surface geology Dominant surface geology is shown in a 25ha grid based on the Danish geological surveys map which cover 75% of the country
Soil sampling for texture analyses • ADK distributed topographic maps and questionnaires to local agronomists (advisors) who registered existing texture analyses • The agronomists were asked to recommend suitable locations for forthcoming soil sampling • ADK combined the recommendation with infor-mation on topography and surface geology and the final sampling sites were chosen • The agronomists undertook the soil sampling. 36000 topsoil samples (0-20cm) and 6000 subsoil samples (35-55cm) were taken
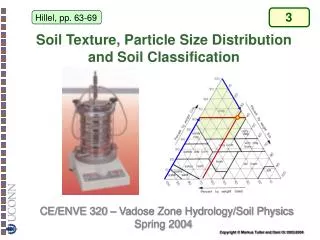
Analyses Texture: 2mm, 20mm, (63mm), 200mm, 2000mm Hydrometer method and sieving Organic C: Determined by a Leco-apparatus Lime: Determined by treating the samples with HCl and capture the carbondioxide in bariumhydroxide
Map construction • The borders on the soil maps were drawn by the crew at ADK in cooperation with the local agronomists • The drawing of the borderlines was based on the texture analyses, landscape analyses, the surface geology maps and the local knowledge from the agronomists involved. • The maps were digitized and all analytical data were stored in a database. The software was developed as a Ph.D. study at Århus University
Additional soil maps 1980-1985 • Geomorphological map • Subsoil texture map • Wetland map • Potential acid sulfate soil • Soil map of the forests
Soil chemical and physical data • By combining the different soil maps an area can be characterized as follows: Topsoil: Fine sand (MCC2) Subsoil: loam (MCC5) Drainange: not wetland Geomorphology: Weichsel moraine • In order to use the soil maps in planning there is a huge need for soil profile analytical data, chemical as well as physical
Classification system The classification based exclusively on field observations. Describe the main pedological development within 120cm. Describe the presence of gley, lithic and limestone contact within 3 sections of the profile: 0-40, 40-80 & 80-120 cm Describe the thickness and carbon content of the A-horizon Describe the presence of fragipan, placic horizon, degradated B-horizons, cementation, calcic horizons
Danish soil classification system, soil groups Group leveI 1 2 3 Lessive ranker* gley* podzol rendzin* pseudogley* brunjord degra stagnogley* brunsol blandings typi *begin at 40-80cm Example: Degralessive Podzolpseudogleytypilessive
Danish soil classification system, soil series • Gley, lime and lithic contact in the soil section 80-120 cm • Placic horizon, fragipan, cementation, degradated Bt or Bs horizons, natric horizons, all within 1.2 meter depth • entic A-horizons (<10cm), kolluvial A horizon (40-80cm) humus poor A-horizon (10-40cm thick and <1% OM), humus rich A-horizon (10-40cm thick and 7-20% OM), histic O-horizon 10-40 cm thick and >20%OM. • Example: kolluvial pseudogleyey Typilessive • entic Degralessive
Soil name at order, group and series Podzol (A-E-Bh-Bs-C) 1)Typipodzol (gley > 120cm depth) 2) gleyey Typipodzol (gley 80-120cm) 3) Gleytypipodzol (gley 40-80cm) 4) Podzolgley (gley 0-40cm)
Finding special soil types Podzols with placic horizons Order 06; group 26 = all podzols + series 13 = placic Soils with Bt and lime beginning below 80-120 cm Order 05; group 25 = soils with Bt + Series 16 + 17 = lime beginning below 80 cm Soils with deep A-horizons Order 07 = A horizons deeper the 80 cm + series 01 = A horizons 40-80 cm deep
Soil toposequence based on soil classification for every 25 meter on the pipeline
Rendzinleptosol on Senon limestoneCambisol in calcareous loamy till
Inner marsh clay upon a podzolFluvisol in outer marsh deposits
Analyses • Texture (hydrometer + sieving) • Total carbon (dry combustion) • Total nitrogen (Kjeldahl) • Total organic and inorganic phosphorous • pH(H2O) and pH(CaCl2) • Lime content (Scheibler) • Exchangeable acidity at pH 8.1 (Pipers method) • Exchangeable bases (NH4Ac-extraction at pH7) • DCB, oxalate and pyrophosphate iron and aluminium • KCl-extractable H and Al • Soil water retention (Pressure plate apparatus)
The use of the databases Protection of fertile farmland around towns Irrigation need for agriculture production at county level Irrigation permission Hunting zones Economical compensation for drainage The potential drainage need at national level Mapping of potential set aside area Carbon storage in Danish soils Nitrate leaching from farmland Potentially acid sulfate soil
Example of rules for irrigation permission Ribe County If a farmer wants to irrigate his fields he has to get a soil texture analyses of the plowlayer and send it to the county administration. They use the following equation derived from the soil profile analytical database PAW: 2.34*OM% + 0.70*clay + 0.47*silt + 0.18*FS + 3.68 If PAW < 20 the farmer may irrigate with 100mm/ha If PAW is 20-30 the farmer may irrigate with 75mm/ha If PAW is >30 the farmer may irrigate with 50mm/ha