Download
1 / 26
260 likes | 411 Views
THE RISK OF RANDOM ERROR (PLAY OF CHANCE). Goran Poropat. Introduction. No physical quantity can be measured with perfect certainty All measurements are prone to errors. Experimental errors. Do not refer to mistakes, blunders, or miscalculations

E N D
THE RISK OF RANDOM ERROR (PLAY OF CHANCE) Goran Poropat
Introduction No physical quantity can be measured with perfect certainty All measurements are prone to errors
Experimental errors Do not refer to mistakes, blunders, or miscalculations (eg. measuring a width when the lenght should have been measured) Inherent in the measurement process
Experimental errors Are measured by • Accuracy – how close a measured value is to the true value or accepted value • Precision – how closely two or more measurements agree with each other (repeatability, reproducibility)
Experimental errors Three dimensions particularly influence the reliability of our observations in clinical research: • RANDOM ERRORS (PLAY OF CHANCE) • SYSTEMATIC ERRORS (BIAS) • DESIGN ERRORS
Bias A systematic error – deviation from the truth, in results or inferences Overestimation or underestimation of the true intervention effect
Bias Affect accuracy of a measurement Should not be confused with imprecision Multilpe replications of the same study – wrong answer on average
Random error Imprecision – refers to random error The unpredictable variation between observed values and some “true” value Possible reason of misleading results in RCTs and meta-analyses
Random error Affects precision of measurement Multilpe replications of the same study Different effect estimates SAMPLING VARIABILITY
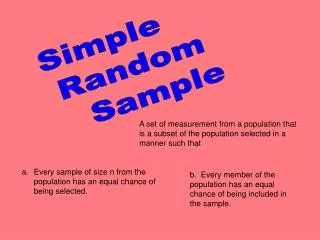
Sampling variability The actual study result will vary depending on who is actually in the study sample A sample – a subset of a population of manageable size
Epidemiological studies Impossible to evaluate every member of the entire population The relationship between exposure and health-related event is judged from observations on a SAMPLE of the population STATISTICAL INFERENCES (extrapolations)
Sampling variability 50 x x 50 N = 4 2 x x 4 2 x
Sampling variability Different inferences – various possible samples Hypothesis Information size Probability of drawing a bad sample Random errors tend to decrease as information size increases
Sampling variability RR Clinicallyimportant overestimate! q 1 Required sample size Number of patients randomised
Epidemiological studies The measure of association we observe (inference) in our data may differ from the “true” measure of association - by chance alone Probability that the observed difference is due to play of chance
Hypothesis testing Quantify the degree to which sampling variability (chance) can explain the observed association Assume H0 is true, and not Ha The probability of obtaining an observed effect (or larger) under a null-hypothesis Assessing H0 P-value
P-value The likelihood of observing certain data given that the null-hypothesis is true P-value threshold = 0.05 – arbitrary Data yielding a P-value = 0.05 – a 5% chance obtaining the observed result, if no real effect exists
P-value A P-value is the probability of an observed (or more extreme) result arising by chance
Misinterpretations P>0.05 “the intervention has no effect” “not strong evidence that the intervention has an effect” “ an intervention has a strong benefit” The P value addresses the question of whether the intervention effect is precisely nil P<0.05
Confidence intervals Another approach to quantify sampling variability Range within which the true magnitude of effect lies with a stated probability, or a certain degree of assurance (usually 95%)
Confidence intervals Point estimate – the actual measure of association given by the data (OR, RR, RD) The best guess of the magnitude and direction of the experimental intervention’s effect compared with the control intervention
Confidence intervals Wider intervals – greater imprecision CI width • Sample size • Precision of individual study estimates • Number of studies combined
Confidence intervals P-value – to which extent the null-hypothesis is compatible with the data CI – the range of hypothesis compatible with the data
Sum up • Random error (due to ’play of chance’) is the unpredictable variation between observed values and some ’true’ value • Everything we attempt to estimate may be subject to some degree of random error
Sum up • Random error affects • Statistical significance • Estimated treatment effects • Heterogeneity estimates • Only a sufficient number of trials and patients will ensure an acceptable risk of random error