Download
1 / 5
50 likes | 68 Views
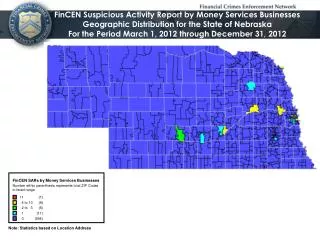
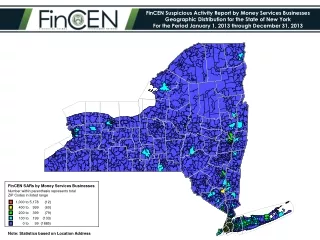
This report provides statistics on the geographic distribution of FinCEN Suspicious Activity Reports (SARs) filed by Money Services Businesses in New York State for the years 2013 and 2014. It includes data on filings by county, filings by metropolitan statistical area, and characterizations of suspicious activity.

E N D
1,000 to 5,178 (12) 400 to 999 (60) 200 to 399 (79) 100 to 199 (133) 0 to 99 (1885) FinCEN Suspicious Activity Report by Money Services Businesses Geographic Distribution for the State of New York For the Period January 1, 2013 through December 31, 2013 FinCEN SARs by Money Services Businesses Number within parenthesis represents total ZIP Codes in listed range Note: Statistics based on Location Address
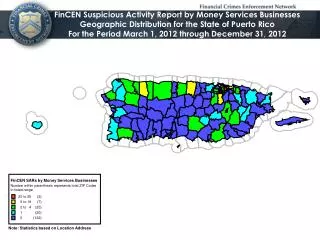
1,000 to 5,178 (12) 400 to 999 (60) 200 to 399 (79) 100 to 199 (133) 0 to 99 (1885) FinCEN Suspicious Activity Report by Money Services Businesses Geographic Distribution for the New York City Area For the Period January 1, 2013 through December 31, 2013 Bronx, New York Queens, New York New York, New York Kings, New York FinCEN SARs by Money Services Businesses Number within parenthesis represents total ZIP Codes in listed range Note: Statistics based on Location Address
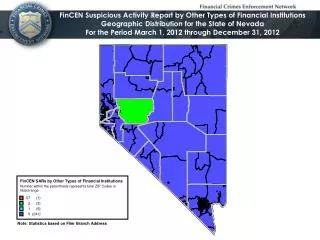
1,000 to 5,178 (21) 400 to 999 (87) 200 to 399 (106) 100 to 199 (150) 0 to 99 (1805) FinCEN Suspicious Activity Report by Money Services Businesses Geographic Distribution for the State of New York For the Period January 1, 2014 through December 31, 2014 FinCEN SARs by Money Services Businesses Number within parenthesis represents total ZIP Codes in listed range Note: Statistics based on Location Address
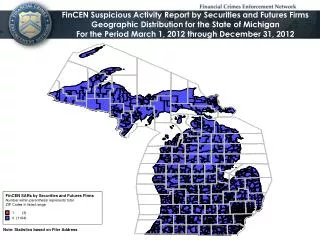
1,000 to 5,178 (21) 400 to 999 (87) 200 to 399 (106) 100 to 199 (150) 0 to 99 (1805) FinCEN Suspicious Activity Report by Money Services Businesses Geographic Distribution for the New York City Area For the Period January 1, 2014 through December 31, 2014 Bronx, New York Queens, New York New York, New York Kings, New York FinCEN SARs by Money Services Businesses Number within parenthesis represents total ZIP Codes in listed range Note: Statistics based on Location Address
Added Value Summary Report Spreadsheets For the State of New York For Calendar Years 2013 and 2014 Filings by County; Filings by Metropolitan Statistical Area; Characterizations by Suspicious Activity Note: By clicking on the above enhancements you will be able to review a two-year comparison of Filings by County; Metropolitan Area; and Characterization of Suspicious Activity for the Suspicious Activity Report filed by Money Services Businesses (FinCEN Form 111).