Download
1 / 1
10 likes | 135 Views
Assessing Worldwide Tropical Cyclone Frequency. Conributors : Dr. Paul Marchese, Daniel Mezzafonte, Joon Chong, David Morales, Michael Hirschberger, and Alana Menendez. Results :. Abstract :

E N D
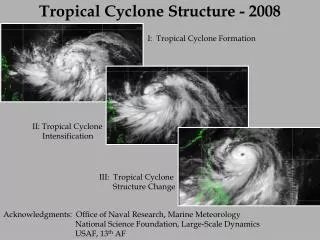
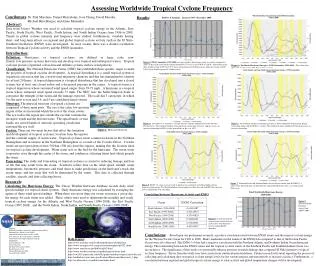
Assessing Worldwide Tropical Cyclone Frequency Conributors: Dr. Paul Marchese, Daniel Mezzafonte, Joon Chong, David Morales, Michael Hirschberger, and Alana Menendez Results: Abstract: Data from Unisys Weather was used to calculate tropical cyclone energy in the Atlantic, East Pacific, South Pacific, West Pacific, North Indian, and South Indian Oceans from 1996 to 2008. Trends in global cyclone intensity and frequency were studied. Furthermore, variables having short- and long-term effects on regional and global tropical cyclone activity such as the El Niño-Southern Oscillation (ENSO) were investigated. In most oceans, there was a distinct correlation between Tropical Cyclone activity and the ENSO anomalies. Introduction: Definition: Hurricanes, or tropical cyclones, are defined as large scale, non- frontal, low pressure systems that form and develop over tropical and subtropical waters. Tropical cyclones possess organized convection and definite cyclonic surface wind patterns. Classification:The National Hurricane Center (NHC) has established three specific stages to mark the progress of tropical cyclone development. A tropical disturbance is a small tropical system of organized convection that has a non-frontal migratory character and that has maintained its identity for at least 24 hours. A tropical depression is a tropical disturbance that has developed into a closed system, has at least one closed isobar and a decreased pressure in the center. A tropical storm is a tropical depression whose sustained wind speed ranges from 39-73 mph. A hurricane is a tropical storm whose sustained wind speed exceeds 73 mph. The NHC uses the Saffir-Simpson Scale to categorize the strength of the storm and the damage expected. The scale has 5 categories, in which 5 is the most severe and 3,4, and 5 are considered major storms. Structure: The physical structure of tropical cyclones are comprised of three main parts. The eye is the calm, low pressure region of the storm around which the rest of the storm rotates. The eye wall is the region just outside the eye that contains the strongest winds and the heaviest rains. The spiral bands, or rain bands, are curved bands of outward, spreading clouds that surround the eye wall. Factors: There are two main factors that affect the formation and development of tropical cyclones: location from the equator and the constant supply of warm water. Tropical cyclones rotate counterclockwise in the Northern Hemisphere and clockwise in the Southern Hemisphere as a result of the Coriolis Effect. Coriolis winds are most prevalent at least 500 km (300 mi) from the equator, making this the location ideal for tropical cyclone development. Warm water acts as the fuel for the hurricane. The warm water evaporates, rises through the center of the storm, and condenses, releasing latent heat which propels the storm. Forecasting: The study and forecasting of tropical cyclones is crucial to reducing damage and loss of life that may result from the storm. Scientists collect data on the wind speed, rainfall, water temperatures, barometric pressure, and wind shear to make predictions on the hurricane’s track, the storm surge, and the areas that will be threatened by the storm. This data is collected through satellite, aircraft, and data-collecting buoys. Figure 2: ENSO Anomalies (1995-2008) are represented by fluctuations in the sea surface temperature (SST) of the region in the Pacific Ocean bounded by 5°N to 5°S and 170°W to 120°W. Fluctuations in the three month average of SST by 0.5°C above normal represent El Niño activity while the average of SST 0.5°C below normal represent La Niña activity. Figure 3: Worldwide Hurricane Energies v. ENSO Anomalies (1995-2008) - The yellow bars represents months in which El Niño events occurred. Figure 4: The ENSO 3.4 anomalies correlate directly with the typhoon data for the Western Pacific Ocean . The Northern Atlantic Ocean hurricane energy data, however, appears to have an inverse relationship to ENSO events, particularly in the year 1997. Figure 5: The Northern Atlantic Ocean hurricane data is shown compared to the Eastern Pacific Ocean data along with the ENSO 3.4 values. The Northern Atlantic and Eastern Pacific data have an inverse relationship. Figure 1: Hurricane Structure Research: Calculating the Hurricane Energy: The Unisys Weather hurricane database records daily wind speed readings for tropical storm systems. Daily hurricane energy was calculated by averaging the square of these wind speed readings. When there was more than one storm system in a given day, the energy for each storm was added. These values were used to determine the monthly and yearly tropical cyclone energy for the Atlantic and West Pacific Oceans (1996-2008), the East Pacific Ocean (1997-2008) , and the North Indian, South Indian, and South Pacific Oceans (2000-2008). Figure 7: Southern Pacific and Southern Indian Ocean data are shown with the ENSO 3.4 values. Note that both times the South Pacific and South Indian data cross, it is during an El Niño event. Figure 6: ENSO 3.4 values were inversed to illustrate its correlation to Northern Indian Ocean tropical cyclone energy. The Northern Indian Ocean tropical cyclone data and the ENSO data have an inverse relationship with each other. Correlation between Hurricane Activity and ENSO Figure 9: Total worldwide hurricane energy from 2000 to 2008. Figure 8: A table showing the numerical correlation between each ocean’s total hurricane activity and the ENSO anomalies. Sponsors: National Aeronautics and Space Administration (NASA) Goddard Space Flight Center (GSFC) Goddard Institute for Space Studies (GISS) New York City Research Initiative (NYCRI) CUNY Queensborough Community College Contributors: Dr. Paul Marchese (PI) Joon Chong (GS) Mr. Daniel Mezzafonte (HST) David Morales (UGS) Michael Hirschberger (HSS) Alana Menendez (HSS) Conclusions: Based upon our preliminary research, a positive correlation exists between ENSO events and the tropical cyclone energy for the Western Pacific Ocean for 1996 to 2008. Many similarities in the trends of the ENSO data compared to that of the Eastern Pacific Ocean were also observed. The ENSO 3.4 data had a negative correlation with the Northern Atlantic and Northern Indian Ocean hurricane energy. The relationship between the ENSO values and the tropical cyclone values of the Southern Pacific and Southern Indian Ocean was inconclusive. The significance of this study is to potentially enhance previous research findings that compared El Niño patterns to tropical cyclone frequency. Errors from this study may have arisen from statistical miscalculations. Future research will entail repeating the process of collecting and calculating data on tropical cyclone energy levels for the various regions and time periods to increase accuracy. Furthermore, a correlation between regional and global tropical cyclone energy to solar activity and global temperature changes will be investigated. References: http://www.usatoday.com/weather/tg/whshear/whshear.htm http://www.aerospaceweb.org/question/atmosphere/q0242.shtml http://www.aoml.noaa.gov/hrd/tcfaq/A5.html http://www.weather.com/encyclopedia/tropical/terms.html http://ww2010.atmos.uiuc.edu/(Gh)/guides/mtr/hurr/stages/cane/wall.rxml http://earthobservatory.nasa.gov/Features/Hurricanes/hurricanes_2.php http://weather.unisys.com/hurricane/index.html