7 elements of remote sensing process
161 likes | 2.49k Views
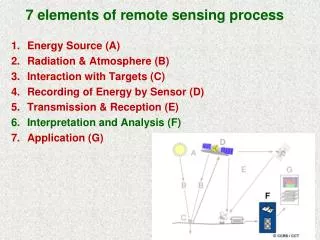
7 elements of remote sensing process. Energy Source (A) Radiation & Atmosphere (B) Interaction with Targets (C) Recording of Energy by Sensor (D) Transmission & Reception (E) Interpretation and Analysis (F) Application (G). Extract meaningful information from imagery.

7 elements of remote sensing process
E N D
Presentation Transcript
7 elements of remote sensing process • Energy Source (A) • Radiation & Atmosphere (B) • Interaction with Targets (C) • Recording of Energy by Sensor (D) • Transmission & Reception (E) • Interpretation and Analysis (F) • Application (G)
Extract meaningful information from imagery 6. Interpretation and Analysis (F) - the processed image is interpreted, visually and/or digitally, to extract information about the target which was illuminated.
4.3 Digital Image Processing Common image processing image analysis functions: A. Preprocessing B. Image Enhancement C. Image Transformation D. Image Classification and Analysis
Background • DIP - manipulation & interpretation of images • Began in 1960’s • 1972 - Landsat 1 launched • Access to low cost, efficient computers • Access to imagery
Pixel Digital spatial image - made up of a grid of cells, each containing a value or measurement and representing an area of the Earth’s surface.
Digital Number (DN) - value stored within a pixel of an image, represents amount of light reflected back to sensor. digital format – images are represented in a computer as arrays of pixels.
Multispectral images - multiple layers representing different parts of the EMS.
1. Pre-Processing (Image Rectification) • Initial processing of raw data prior for analysis • Correct for distortion due to characteristics of imaging system & imaging conditions.
2. Image Enhancement • Solely to improve appearance of imagery. • Increasing visual distinction • Un-enhanced images usually appear very dark - little contrast - difficult to visually interpret. • Various procedures applied to image data in order to more effectively display data for visual interpretation.
Computers - ideal for manipulating and analyzing large continuous data sets displayed as grayscale. • Used to distinguish between slight spectral variations and enhance them.
Lanier.img (4-3-2) Swipe
Applying a histogram stretch produces a simple classification of urban, agricultural, and mixed use areas.
A. Contrast stretchingLinear grey-level stretching • Lower threshold value is chosen so that all pixel values below threshold are mapped to zero. • Upper threshold value is chosen so that all pixel values above threshold are mapped to 255. • All other pixel values are linearly interpolated to lie between 0 and 255. • Lower and upper thresholds are usually chosen to be values close to the minimum and maximum pixel values of the image.
0 = black 255 = white
A sensor measures the electromagnetic energy within its range. Total intensity of the energy from zero to the maximum is broken down into 256 brightness values for 8-bit data.