Download
1 / 18
220 likes | 598 Views
Experimental and Computational Studies of Contact Mechanics for Tire Longitudinal Response. Jacob Kidney, Neel Mani, Vladimir Roth, John Turner, & Tom Branca Bridgestone Americas Tire Operations Product Development Group Akron, OH . 30 th Tire Society Conference Akron, Ohio

E N D
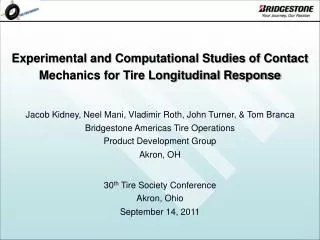
Experimental and Computational Studies of Contact Mechanics for Tire Longitudinal Response Jacob Kidney, Neel Mani, Vladimir Roth, John Turner, & Tom Branca Bridgestone Americas Tire Operations Product Development Group Akron, OH 30th Tire Society Conference Akron, Ohio September 14, 2011
Motivation for Interest in Dry Braking Performance • OEM’s are requiring improved Stopping Distance performance • ABS systems are now standard safety features, and the potential for improvement is enhanced • European & Asian countries have active NCAP programs to Test & Improve Dry Stopping Distance for Safety • Consumers Union & IIHS generate and publish U.S. vehicle ratings and include Stopping Distance as a measure of Safety • SAE Committee has developed a standardized stopping distance test procedure
Tread Belt Belt Tread z Ω VBelt x Vbelt VGround Shear zx(Vg /Vb) GROUND Vground Drive Free Rolling Brake Drive-Brake Force Generation & Slip Zone Evolution 1D Concept “Brush” Model Friction limit = Drive Drive Drive Free Rolling Slip Zone Evolution Shear Stress Shear Stress Brake Brake Brake Friction limit = • Vg/Vb is the Basic Mechanism of Tread Shear Development • Tread Shears until it Reaches Friction Limit • Slip Zones Evolve from the Rear of Footprint
Contact Behavior – Free-Rolling & Braking Conditions Free Rolling Moderate Braking (SR=6%)
FREE ROLLING Slip Zone Evolution & Mu-Slip Curve - Brush Model 0 Driving STICK SLIP STICK SLIP STICK SLIP Braking 0 FREE ROLLING INCREASING BRAKE TORQUE Concept Model 0 0/σ0 Driving Increasing Free Rolling Torque Ramp Braking 0/0 Stress Shape Controlled by Slip Zone Evolution 0 Slip Rate at Peak is Altered as well Shape of the mu-Slip Curve is Affected by Slip Zone Evolution (Rate of Fx generation diminishes as Slip Zone Increases)
Slip Zone Growth – Effects on µ-Slip Shape Experimental Measurement FEA Prediction µ vs Slip Rate µ vs Slip Rate 1.2 1.2 1.0 Drive Torque 1.0 Drive Torque 0.8 0.8 0.6 0.6 0.4 0.4 Brake Torque re-plotted in Drive Quadrant Brake Torque re-plotted in Drive Quadrant 0.2 0.2 µ (Fx/Fz) µ (Fx/Fz) 0 0 -0.2 -0.2 -0.4 -0.4 Brake Torque -0.6 -0.6 -0.8 -0.8 Brake Torque -1.0 -1.0 -1.2 -1.2 -15.0 -12.5 -10.0 -7.5 -5.0 -2.5 0 2.5 5.0 7.5 10.0 12.5 15.0 -15.0 -12.5 -10.0 -7.5 -5.0 -2.5 0 2.5 5.0 7.5 10.0 12.5 15.0 Slip Rate (%) Slip Rate (%) Rolling Tire Simulator SST Braking & Cornering
zx/zz Brake Torque - FEA Drive Torque - FEA SLIP Example of Contrasting Slip Zone Growth Rates Experimental Measurement FEA Prediction Travel TRAILING EDGE LEADING EDGE SLIP ZONE ZONE Brake Torque – Concept Model INCREASING TORQUE zx/zz SLIP STICK STICK SLIP STICK SLIP SLIP ZONE Drive Torque – Concept Model • Drive & Brake mu-Slip Curves Differ due to Slip Zone Evolution
Slip Zone Evolution for All-Season Tire Under Braking FRONT REAR Rolling Direction Slip Zone Growth zz LOW HIGH SR = 0% SR = 2% SR = 4% SR = 6% SR = 8%
Fundamental Studies of Lift-Off Increased Braking Free Rolling Heavy Braking Medium Braking “Summer” Contrasting Lift-Off “All Season” “Winter”
Coef. of Friction Contact Pressure Friction – Impact of Pressure Dependence Free-Rolling Braking Lug Lift Z Lug LIFT-OFF WHEN Z=0 Braking Shear Lug Lift-Off Reduces Contact Area and Increases Dry Stopping Distance. WHY?? Coef. of Friction is Pressure Sensitive 140 250 375 280 500 420 Pressure (kPa) 625 Velocity (mm/sec) 560 750 700 Reduced Area Increased z Reduced COF Increased DSD
Impact of Friction Law on Braking Performance Sliding Direction Apply Load Un-Deformed Lug Mu vs Distance – Comparison between Friction Laws Constant COF 18% Decrease Mu (Fx/Fz) COF Variable COF Pressure Distance
Impact of Sipes on Braking Performance Mu vs Distance – Siping Impact Solid Lug 19% Decrease Mu (Fx/Fz) 2-Sipe Lug Solid Lug Contact Pressure (kPa) - 1900 - 330 - 300 - 270 - 240 - 210 - 180 - 150 - 120 - 90 - 60 - 30 - 0 2-Sipe Lug 2-Sipe Lug Distance Lug Sliding (Mesh) Contact Pressure while Sliding Lift-Off Zones Lift-Off Zone Solid Lug 2-Sipe Lug Solid Lug 2-Sipe Lug
Impact of Contact Stress on Braking Performance Mu vs Distance – Impact of Contact Stress 6% Drop 6% Drop Mu drops with increased Fz Mu (Fx/Fz) Fz = 225 N Fz = 300 N Fz = 375 N Distance Fz = 225 N Fz = 300 N Fz = 375 N Contact Pressure (kPa) Increased Pressure @ Leading Edge Moderate Pressure @ Leading Edge Very High Pressure @ Leading Edge - 360 - 330 - 300 - 270 - 240 - 210 - 180 - 150 - 120 - 90 - 60 - 30 - 0
Implications for ABS Braking Performance 46.0 45.7 Stopping Distance Performance 45.4 45.1 44.8 44.5 DSD (m) 44.2 43.9 43.6 43.3 43.0 42.7 52.1 51.8 51.5 51.2 50.9 • If several different tire sets are tested on multiple vehicles, Stopping Distance rank order will likely change. • A tire-vehicle interaction is involved that influences performance. 50.6 DSD (m) 50.3 50.0 49.7 49.4 49.1 48.8
Implications for ABS Braking Performance Mu-Slip Curves for Various Tires Stopping Distance for Various Tires Tire A Tire B Tire C Mu (Fx/Fz) Stopping Distance Tire A Tire B Tire C Slip Rate Tire Slip Rate vs Time SR Cycling with Phase Lag LF SR RF SR Fz5 Fz4 Fz3 Fz2 Mu (Fx/Fz) Slip Rate Fz1 Tire Mu-Slip Curves & ABS Cycling Slip Rate Time (sec)
Implications for ABS Braking Performance Mu-Slip Curves for Various Tires • Peak Is Constant • Slope & Curvature Varied • CONSIDER A “SLIP RATE-BASED” ABS CONTROLLER Mu (Fx/Fz) ABS Operating Range (SR-Based ABS Controller) Tire A Tire B Tire C 0% 2% 4% 6% 8% 10% 12% 14% 16% 18% 20% 22% 24% 26% Slip Rate
Implications for ABS Braking Performance Mu-Slip Curves for Various Tires • Peak Is Constant • Slope & Curvature Varied • CONSIDER A “SLIP RATE-BASED” ABS CONTROLLER ABS Operating Efficiency is Influenced by the Shape of the mu-Slip Curve Mu (Fx/Fz) ABS Operating Range (SR-Based ABS Controller) Tire A Tire B Tire C 0% 2% 4% 6% 8% 10% 12% 14% 16% 18% 20% 22% 24% 26% Slip Rate
Implications for ABS Braking Performance Base Mu-Slip Curves for Different Tires Tire A • Peak Is Constant • Slope & Curvature Varied • CONSIDER A “PEAK-SEEKING” ABS CONTROLLER Tire B Mu (Fx/Fz) ABS Operating Efficiency is Influenced by the Shape of the mu-Slip Curve Slip Rate Mu-Slip Curves for Different Tires Mu-Slip Behavior for Different Tires during an ABS Simulation Steady ABS Operation Transient Tire A Tire B Braking Force, Fx Braking Force, Fx Penalty for Excessive Pressure Release PERFORMANCE LOSS BETTER PERFORMANCE Tire A Tire B Slip Rate Time