Fatigue Design
Fatigue Design. Dept. of Civil and Environmental Eng. Chang-Ang Unversity Korea Kyong-Ho Chang. Seoul ,KOREA. Fatigue Design. 1) Introduction(Background of fatigue) 2) General Concepts of Fatigue 3) Fatigue Design 4) Fatigue Standard of Various Countries


Fatigue Design
E N D
Presentation Transcript
Fatigue Design • Dept. of Civil and Environmental Eng. • Chang-Ang Unversity • Korea • Kyong-Ho Chang • Seoul ,KOREA
Fatigue Design 1) Introduction(Background of fatigue) 2) General Concepts of Fatigue 3) Fatigue Design 4) Fatigue Standard of Various Countries 5 ) Current Research of Fatigue 6) Example of Fatigue Design -AGENDA-
1) Introduction ( Background of study) • Steel Structure(Steel Bridge) • Advance in technology : new structural steel and new analysis method • steel structure research field : • : Fatigue, Fracture,Welding and Joining, Buckling, Seismic, Dynamic, Composite etc.
1) Introduction ( Background of study) Fabrication of steel structure Outstand characteristics : construction, maintenance. Particularity, the steel structure member is more competitive material for the construction of long span bridge. Welding Bolting
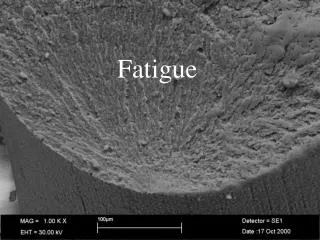
1) Introduction ( Background of study) Sample of Collapse of bridge Cause of collapse : Traffic increase, welding defect + fatigue. The case of fatigue fracture is more than 80%. SungSu Bridge, in seoul 21/10/1994 It is possible to assure the predict life for steel structure once a proper fatigue design criteria established.
5 2. General Concepts of Fatigue 2.1 Stress intensity factor(K) 2.1 Stress intensity factor(K) 2.1.1 Introduction • Fatigue Life : Crack Initiation Life + Crack Propagation Life. • From an inspector viewpoint, crack size is different. From micro viewpoint, crack is 0.1mm. From macro viewpoint, crack is 0.2 ~ 1mm(in case of small specimen) , and 10mm(in case of actual structural member). • Fatigue problem can be divided by low cycle fatigue and high cycle fatigue. • In the low cycle fatigue, main interest is crack initiation life. Fatigue life is estimated by strain-life approach. • In the high cycle fatigue, main interest is crack propagation life. Fatigue life is estimated by fracture mechanics method Repeat number is more than 104 .
5 2. General Concepts of Fatigue 2.1 Stress intensity factor(K) 2.1.1 Introduction • When structure is designed by general method, since structure is designed under allowable stress level, then the structure applies in low cycle fatigue case. However, if structure have a discontinuity and some defect, since these have notch effect , thus, stress is generated more than low cycle fatigue level. Eventually, notch part show behavior of high cycle fatigue and it is need to approach fracture mechanics.
5 용접 부식 2. General Concepts of Fatigue 2.1 Stress intensity factor(K) 2.1.1 countermeasure for propagation of fatigue crack • - In small size crack- 1) stop-hole method 2) remelting method by TIG(Tungsten Inert Gas) welding - In large size crack- 1) replacement method by new plate. 2) overlay plate method by bolting
5 2. General Concepts of Fatigue 2.1 Stress intensive factor(K) 2.1.2 LEFM(: Linear Elastic Fracture Mechanic) : LEFM is based on the elastic theory that stress and strain have linear relation. Let’s suppose that small displacement is generated in member which exist crack and defect. And, this assumption is available. Because plastic deformation of end of crack is too small in proportion to whole size of member.
5 2. General Concepts of Fatigue 2.1 Stress Intensity Factor(K) 2.1.3 Stress Intensity Factor(K) : variable that define magnitude of local stress adjacent to tip of crack. This is different from the stress concentration factor. Stress concentration factor just applies to perfectly elasticity. If tip of crack have very a sharp point, stress concentration factor is given as infinite stress in tip of crack. But, this can not be happened in real situation. If plastic deformation is generated in tip of crack and then, stress can be relieve. Eventually, stress concentration factor is reduced. Therefore, if plastic deformation is generating, it is difficult to continually apply the concept of stress concentration factor . So, This is the reason that introduced stress intensity factor(K).
5 2. General Concepts of Fatigue 2.1 Stress Intensity Factor(K) 2.1.3 Stress Intensity Factor(K) • K is defined according to fracture mode as follows: - Mode I : opening and tensile Mode type - Mode II : in plan shear type - Mode III : Out plan shear type mode I Mode II Mode III (Cleavage style) (Shearing style) (Tearing style)
5 2. General Concepts of Fatigue 2.1 Stress Intensity Factor(K) 2.1.3 Stress Intensity Factor(K) : K differ from load and magnitude , shape of crack and geometric boundary element. Formula of K isasfollow: where, σ : nominal stress acting on member. ɑ : crack length f(g): modify factor by specimen and crack geometric shape.
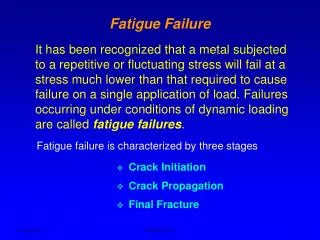
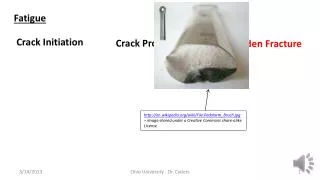
5 2. General Concepts of Fatigue 2.2 Initiation and Propagation of Fatigue Crack 2.2 Initiation and Propagation of Fatigue Crack. : propagation life is a problem in FSD(Fail Safe Design) and DAD(Damage Allow Design) Fatigue crack = crack initiation step + crack propagation step. At crack initiation step of the first step, fatigue crack entirely has a slop of 45˚ about direction of maximum tensile stress. At crack propagation step of second step, cleavage crack and striation are appeared and then lastly, it is destroyed of 45˚. At crack propagation step of second step, it is treated many mechanical approach. Fig 2.1 Initiation and propagation of Fatigue crack
5 2. General Concepts of Fatigue 2.2 Initiation and Propagation of Fatigue Crack According to calculate of elastic stress, the stress of tip of crack is infinite. Thus, we can not discuss about strength of crack base on the stress. But, if plastic deformation of tip of crack is too small, we can express the stress and strain adjacent to the tip of crack by using stress intensity factor K. Therefore, we also can express fatigue crack propagation by function of stress intensity factor(K).
5 2. General Concepts of Fatigue 2.2 Initiation and Propagation of Fatigue Crack ΔK(=Kmax-Kmin) is divided by 3 areas as shown as next figure. In range II(a), crack propagation rate is prominently decreased with reduction of ΔK. And, at any point, it does not grow any more. This limitation is called low critical condition. In range II(c), crack propagation rate is abruptly increased with increase of ΔK. And, if Kmaxreach fracture toughness value Kc , Kmax is instability destroyed by static fracture mechanism. Since Fracture toughness value Kc is generally lower then static fracture toughness value , it is called fatigue fracture toughness Kfc. Middle range II(b) is range of stable crack propagation. Crack propagation rate is express by next formula. (Fig 2.2 Relation between fatigue crack propagation rate and stress intensity factor range. )
5 2. General Concepts of Fatigue 2.2 Initiation and Propagation of Fatigue Crack It is called PARIS law: where , C: material constant m : material constant (m can be fluctuated by materials. And it also get value from 2 to 7. m varies by high toughness material, and middle toughness material, low toughness material.) The toughness of material is getting lower , m is getting bigger. And, it doesn’t clear to go the step of II(a)→ II(b)→II(c). (Fig 2.3 comparison characteristic of fatigue crack propagation with alternative toughness materials. )
5 2. General Concepts of Fatigue 2.2 Initiation and Propagation of Fatigue Crack This knowledge system that is discussed crack strength base on stress parameter is called fracture mechanics. In tip of crack, if plastic deformation is getting bigger, we need to consider elastic-plastic fracture mechanic parameterinstead of stress intensity factor(K). However, in structure of civil part, fatigue design which doesn’t permit large scale yield state is general. So, we don’t need to consider about elastic-plastic parameter in design level. However, in order to predictfinal failure life of structure, J-integral, CTOD, G(energy release) must be applied . Because, it can not be solved by just using stress intensity factor(K).
5 2. General Concepts of Fatigue 2.3 S-N diagram 2.3 S-N diagram 2.3.1 Concept of S-N diagram Let’s take an example case as follow : If loading is repeated, the crack is generated at fillet welding end of tip on the base plate. This crack propagate to the direction of thickness and width of plate according to repeat number of load . If crack increases and remaining section of base plate decreases, the base plate is destroyed in a moment by brittle failure. Like this, fatigue is phenomenon that crack is generating and propagating and destroying by repeat loading. (Fig 2.4 model of fatigue crack)
5 2. General Concepts of Fatigue 2.3 S-N diagram 2.3.1 Concept of S-N diagram One cycle is once repeated number from some maximum stress to next maximum stress or from some minimum stress to next minimum stress. The change of stress can be expressed by using next some 2 stress. : minimum stress : maximum stress : mean stress : stress range : stress amplitude : stress rate (Fig 2.5. Relation stress and time in fatigue)
5 2. General Concepts of Fatigue 2.3 S-N diagram 2.3.1 Concept of S-N diagram In general, The change of stress is expressed by stress range Δσ and stress rate R. As shown as next figure, when R= -1, namely, maximum and minimum stress are same, we call perfectly alternating. when R=0, namely, minimum tensile stress equals 0, we call perfectly pulsating. when 0 < R≤1 , namely, minimum tensile stress is bigger than 0, we call incomplete pulsating. (Fig 2.6. load and stress rate R)
5 2. General Concepts of Fatigue 2.3 S-N diagram 2.3.1 Concept of S-N diagram In here, N is repeat number until destroyed of specimen in fatigue test for some stress rate R. In general, from the result of fatigue test, when stress range become small, repeat number N get longer until destroying by fatigue. In here, the relation of stress range Δσ and repeat number N are almost similar toward right down direction in two logarithmic graph. log N = log c – m log(Δσ) where, c and m : constant log : common logarithm we call this relationship, S-N curve. S is stress and N is repeat number. And in an point of of S-N curve, stress range Δσ is fatigue strength and repeat number N is fatigue life. (Fig 2.7. Relation stress rangeΔσ and repeat number N( S-N curve))
5 2. General Concepts of Fatigue 2.3 S-N diagram 2.3.1 Concept of S-N diagram If stress range decreases, even load is infinitely repeated, fatigue failure does not happen. About repeat loading of infinity cycle, upper limit value of stress range is called fatigue limit. We can think about fatigue phenomenon separately as elastic fatigue and plastic fatigue. The fatigue phenomenon by repeat stress of lower than yield point is called elastic fatigue. Repeat number of elastic fatigue is more than 104 . In the other hand, plastic fatigue phenomenon is appeared in repeat number of less than 104 . The case that stress level is higher or same than yield pointis called plastic fatigue. Vvvv Fatigue design concept of steel bridgeis for safe life. Therefore it is against elastic fatigue behavior. (Fig 2.7. . Relation stress rangeΔσ and repeat number N( S-N curve))
5 언더 컷 용입부족 2. General Concepts of Fatigue 2.3 S-N diagram 2.3.2 S-N curve of notched member In member which exist notch and geometric discontinuity, even though nominal stress is smaller than elastic limit σE , stress concentration is generated at this notch and discontinuity area. Fatigue crack is usually generated in welded part in steel bridge. Stress which generated in section away from notch, namely, nominal stress σn is constantly distributed. The magnitude of stress as follows; The distribution of stress of notched section is not constant. If notch tip has elastic state, elastic stress of notch tip is expressed by σt . In real situation, if plastic is generating at notch tip, stress of notch tip must not be more than yield stress σy . (Fig 2.8. Stress distribution in notched member)
5 2. General Concepts of Fatigue 2.3 S-N diagram 2.3.2 S-N curve of notched member Elastic stress σt is bigger than nominal stress σn . Factor which is related with elastic stress σt of notch tip and nominal stress σn is called stress concentration factor(Kt). When area of plastic strain which generated at notch tip is small and the around is elastic state, elastic stress range of notch tip dominates initiation of fatigue crack.. Δσt = KtΔσn where, Δσt : elastic stress σt range of notch tip. Δσn : nominal stress σn range.
5 2. General Concepts of Fatigue 2.3 S-N diagram 2.3.2 S-N curve of notched member When it is described S-N curve of notched member, if has been used Δσn (nominal stress range) against S, several S-N curve depends on the size of stress concentration factor is obtained. If has been used Δσt (elastic stress range) against S, one S-N curve is obtained. (a) S-N curve from σn (b) S-N curve from σt (Fig 2.9. S-N curve based on crack propagation approach)
2. General Concepts of Fatigue 2.3 S-N diagram 2.3.3 Decision process of S-N diagram by crack propagation approach Integrating ( Paris equation ), it can find out repeat number Nwhich is required to propagate crack from initial crack length ɑi to any crack length. Where; ɑi = initial crack length ɑ = any crack length N = repeat number ΔK= range of stress intensity factor.
2. General Concepts of Fatigue 2.3 S-N diagram 2.3.3 Decision process of S-N diagram by crack propagation approach If stress intensity factor range ΔK substitute to the above formula, as follow: If ΔK > lower limit stress intensity factor ΔKth , then fatigue crack is propagated. Thus, when stress range is greater than Δσin next formula, crack is propagated. → Where; ai = initial crack length a = any crack length N = repeat number
2. General Concepts of Fatigue 2.3 S-N diagram 2.3.3 Decision process of S-N diagram by crack propagation approach Any crack length (ɑ) is not longer than limit crack length ɑc . → When f(g) is function of crack length ɑ, this formula have to be solved by nonlinear equation. Showing the relation between the formula and on logarithmic graph. as follows: Fig 2.10 S-N curve based on crack propagation approach
2. General Concepts of Fatigue 2.3 S-N diagram 2.3.4 Decision making of S-N Diagram Eq. is transformed as follows : If stress range is same, (Δσ)m is constant. Thus deviation of c is equal to deviation of N. After the fatigue is testing, to avoid the deviation, the S-N curve is decided by statistical method. The fatigue life in the design S-N curve is repeat number that member is destroying
2. General Concepts of Fatigue 2.3 S-N diagram Showing the relation between stress range Δσ and repeat number N on same graph, as follow: Applying to the least square method , estimates of c and m, as follows; where, Ni , Δσi : repeat number and stress range of fatigue specimen k : : Total number of fatigue specimen (Fig 2.11 fatigue test results and design S-N curve)
2. General Concepts of Fatigue 2.3 S-N diagram 2.3.4 Decision making of S-N Diagram Above mentioned formula represent mean fatigue life for any stress range Δσ. Standard deviation of logN for log(Δσ ) as follow : In real situation, the curvewhich is moved about ν (=2) times ξN (standard deviation) is using. This curve is adjacent to the lower limit of stress. Eliminating logarithmic value, where, (Fig 2.11 fatigue test results and design S-N curve
2. General Concepts of Fatigue 2.3 S-N diagram 2.3.5 S-N diagram for variable load. Fatigue propagation rate of fatigue crack under variable load as follows: Integrating this equation (from initiation crack length to any crack length), S-N curve as follows: Where , c is equal to equation above mentioned. When variable stress range spectra is given by probability density function f(Δσ), Δσrms is as follows:
2. General Concepts of Fatigue 2.3 S-N diagram 2.3.5 S-N diagram for variable load. Next formula is fatigue crack propagation rate which is more safer than above formula. In the same way, integrating this equation, S-N curve as follows: When variable stress range spectra is given by probability density function f(Δσ), Δσrmc as follows: This formula is more safer than
2. General Concepts of Fatigue 2.3 S-N diagram 2.3.5 S-N diagram for variable load. Generally, in case that variable stress range spectra is given by probability density function f(Δσ), equivalent stress range Δσeas follows: In general, m=3 for vertical stress. Thus, Thus, equivalent stress range Δσeas follows: Then, When variable stress range spectra is given by histogram, it is good to substitute next formula for above formula.
2. General Concepts of Fatigue 2.3 S-N diagram 2.3.5 S-N diagram for variable load. When fatigue safety is confirmed, First, calculate equivalent stress range like this. Second, compare equivalent stress range with allowable fatigue stress. If above formula is true, then it is safe from fatigue failure. or Where; m = 3
2. General Concepts of Fatigue 2.4 Fatigue behavior under constant amplitude load 2.4.1 Theory based on LEFM (Linear elastic fracture mechanics) Paris are expressed fatigue crack propagation ratio(dɑ/dN) by function of variable range(ΔK) of stress intensity factor. Walker and Forman was proposed next formula that fatigue crack propagation ratio is expressed by variable range of stress intensity factor and function of mean value of stress. Elber was proposed next formula that fatigue crack propagation ratio is expressed by variable range of stress intensity factor. where, U : Effective stress ratio In attention, Erdogan, Liu, Tomkins, Raju, Frost & Dixon, Pook & Frost etc.
2. General Concepts of Fatigue 2.4 Fatigue behavior under constant amplitude load 2.4.1 Theory based on LEFM (Linear elastic fracture mechanics) Crack initiation life is short in stress concentration part such as notch, discontinuity part. Thus, crack propagation life(II(a) area) dominate structure life. Let’s get the fatigue life by Paris law. where, ɑi : Initial crack length ɑf : Final crack length In first, To calculate fatigue life Nf , final crack length ɑf has to calculate. Final crack length ɑf get from stress intensity factor da a ò = f N f D m C ( K ) a i
2. General Concepts of Fatigue 2.4 Fatigue behavior under constant amplitude load • 2.4.2 Theory based on elastic plastic fracture mechanics. • Like earthquake, fracture mechanism of large scale yield under low cycle can not apply to • elastic fracture mechanic method. • Thus, fracture problem have to solve by J-integral, crack opening displacement(COD), • energy release ratio , etc. • Relationship between energy release ratio and stress intensity factor • Condition of crack propagation is (Plane stress) (Plane strain)
2. General Concepts of Fatigue 2.4 Fatigue behavior under constant amplitude load (2) Relationship between J-Integral(J) and stress intensity factor(K) Where, Γ : Random path of crack T : stress vector on Γ by vertical unit vector n at path Γ as σijnij u : Displacement vector W : strain energy density σij : stress tensor εij : strain tensor