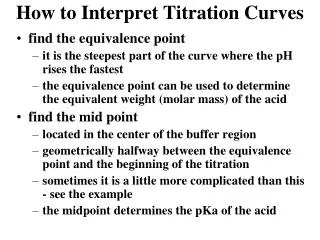
Download
1 / 18
180 likes | 264 Views
How to Read, Develop, and Interpret GRAPHS!. OBSERVATIONS: often are recorded in a data table INTERPRET (make inferences of) your DATA TABLE by performing an ANALYSIS using GRAPHS. What is the relationship between Rabbits and Years for the following example: GRAPH IT.

E N D
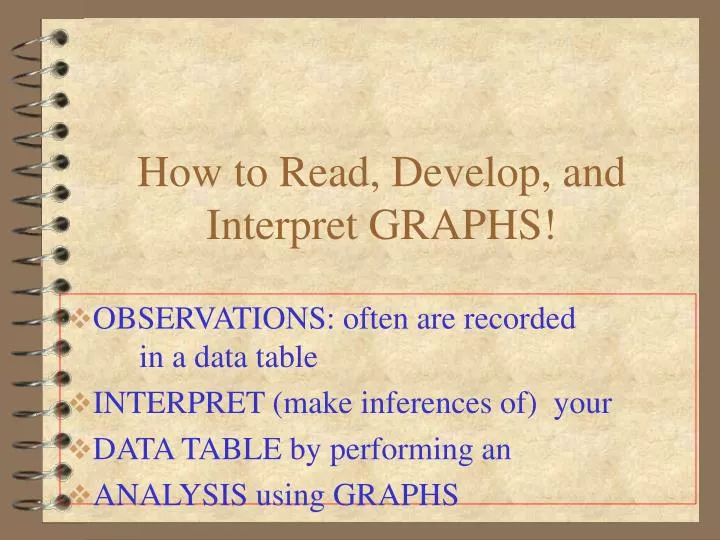
How to Read, Develop, and Interpret GRAPHS! OBSERVATIONS: often are recorded in a data table INTERPRET (make inferences of) your DATA TABLE by performing an ANALYSIS using GRAPHS
What is the relationship between Rabbits and Years for the following example: GRAPH IT YEAR # of RABBITS 1990 500 • 600 1994 800 1995 900 1996 1200 1998 1800
ANALYZE your DATA Step One: Identify your problem: What is the relationship between the years and the number of rabbits
Step Two: Draw your Axis Y-axis X-axis
Step Three: Label Your X Axis: Y-axis What is the relationship between years the number of rabbits 1990 1992 1994 1996r 1998 2000 Years X-axis
Step Three: Now Label Your Y Axis: Y-axis What is the relationship between years and the number of rabbits 1000 900 800 RABBITS 700 600 500 1990 1992 1994 1996r 1998 2000 YEARS X-axis
Step Three: Now Label Your Y Axis: Was there enough room to label your y axis completely for this problem? Y-axis 2100 1800 1500 RABBITS 1200 900 600 1990 1992 1994 1996r 1998 2000 YEARS X-axis
Step Four: Now Plot Your Points Y-axis 2100 1800 1500 RABBITS 1200 900 600 1990 1992 1994 1996 1998 2000 Years X-axis
Step Four: Now Draw Your LINE Y-axis 2100 1800 1500 RABBITS 1200 900 600 1990 1992 1994 1996 1998 2000 Yearss X-axis
Step Five: Answer the Problem What are the characteristics of the Red Star? Y-axis 2100 1800 1500 RABBITS 1200 900 600 1990 1992 1994 1996 1998 2000 Years X-axis
Step Five: Answer the Problem What is the x coordinate and the y coordinate of the red star? Y-axis 2100 1800 1500 RABBITS 1200 900 600 1990 1992 1994 1996 1998 2000 Years X-axis
Step Five: Answer the Problem What is the x coordinate and the y coordinate of the green dot Y-axis 2100 1800 1500 RABBITS 1200 900 600 1990 1992 1994 1996r 1998 2000 Yearss X-axis
Step Five: Answer the Problem What are the characteristics of the Green Star? Y-axis 2100 1800 1500 RABBITS 1200 900 600 1990 1992 1994 1996 1998 2000 Years X-axis
Step Five: Answer the Problem What would you estimate the rabbit population to be in 2000? Y-axis 2100 1800 1500 RABBITS 1200 900 600 1990 1992 1994 1996 1998 2000 Years X-axis
Step Five: Answer the Problem What would be the x and y coordinates for your prediction of the rabbit population in 2000? Y-axis 2100 1800 1500 RABBITS 1200 900 600 1990 1992 1994 1996r 1998 2000 Years X-axis
Step Five: Answer the Problem This ia called an EXTRAPOLATION Y-axis 2100 1800 1500 RABBITS 1200 900 600 1990 1992 1994 1996r 1998 2000 Years X-axis
Step Five: Answer the Problem This is called an INTERPOLATION Y-axis 2100 1800 1500 RABBITS 1200 900 600 1990 1992 1994 1996 1998 2000 Years X-axis