Download
1 / 17
170 likes | 327 Views
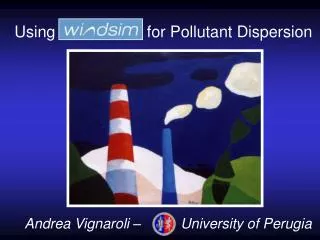
Using for Pollutant Dispersion. Andrea Vignaroli – University of Perugia. In collaboration with…. Vector AS. &. UNIVERSITA’ DEGLI STUDI DI PERUGIA. Facoltà di Ingegneria. Dipartimento di Ingegneria Industriale. The aims of this work… To develop hidden potentialities of Windsim

E N D
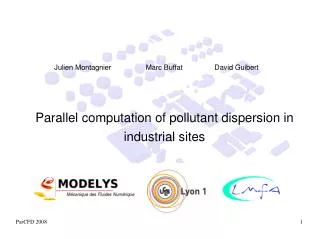
Usingfor Pollutant Dispersion Andrea Vignaroli – University of Perugia
In collaboration with… Vector AS & UNIVERSITA’ DEGLI STUDI DI PERUGIA Facoltà di Ingegneria Dipartimento di Ingegneria Industriale
The aims of this work… • To develop hidden potentialities of Windsim • To put the basis for the realization of a new commercial software D.I.IN.
Foreseing pollutant emissions can be important to… • interpretate data measured by the interest area monitoring web • necessary for the Valuation of Environmental Impact of future factories or infrastructure D.I.IN.
Applicabilty Fields • Spatial Scale: local and meso scale; • Territory type: every kind of site (complex terrain) • Time Scale: every kind of period (from 1 hr to a year) • Source type: every kind source that can be discretized • with an emission point • Pollutant type: gas, smells & particles D.I.IN.
Dispersion Modelling on PHOENICS Two approaches for Two different tipology of pollutants: • GENTRA PARTICLES • PASSIVE DISPERSION GAS & SMELLS D.I.IN.
- GENTRA - Gentra integrates the particle equations in a Lagrangian frame while Phoenics solves the equations governing the continuous phase in the normal manner stochastic particle dispersion model for turbulent flow D.I.IN.
- GENTRA - • Particle Dispersion (Gentra) Data Input: • X, Y , Z local position [m]; • u, v, w inlet velocity vectors [m/s]; • Flux rate in [Kg/s]; • Density [Kg/m^3]; • Particle diameter [m]; • Number of particles to be simulated; • every particle will bring with itself a fraction of the given emission rate D.I.IN.
- GENTRA - Amount of particles in each cell Concentration map D.I.IN.
- GENTRA - Results for 240°-sector simulation D.I.IN.
- Passive Dispersion - “PASSIVE” means… Determining the flow field in the classical way Introducing in the q1 file a new inlet for the pollutant (Gas or smell) New simulation using the previous run as input to the dermine how the new phase is dragged by the wind D.I.IN.
- Passive Dispersion - • Passive Dispersion Data Input : • X , Y , Z position in cell numbers; • Flux rate in [Kg/s]; • Area of Chimney final section [m]; • Temperature [°C]; • Density [Kg/m^3]; D.I.IN.
- Passive Dispersion - Results for 240°-sector simulation D.I.IN.
OUTPUT DATA Strictly Correlated to what the enviromental laws prescribe • Importants Outputs are… • concentration map of short term simulation for a given wind speed and direction • 3D visualization of the concentration field using isosurfaces • concentration map of a long term simulation for a given one – year - climatology ? D.I.IN.
- Output Data - For long term simulation the climatology influeces the windfield module 12 sectors climatology 12 Averaged speeds over boundary layer 12 Phoenics runs with different input D.I.IN.
- Output Data - One-year-averaged concentration map D.I.IN.
…WORK IN PROGRESS • Something for the future… • validate the model with measured data • prescribed pollutant limit as input in order to have percentiles, and map with over valued concentration points • 24 sectors climatology for smoother maps • linear and volume sources D.I.IN.