Download
1 / 15
150 likes | 259 Views
Learn about Madras Fertilizers Group's financial performance and ratios for better analysis. ROE, ROA, Liquidity Ratios, Leverage Ratio, and more included. Access the latest data for informed decision-making.

E N D
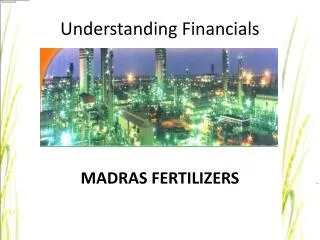
Understanding Financials MADRAS FERTILIZERS
GROUP MEMBERS • AdityaAwasare – 01 • AdityaTawde - 02 • KrishnanandShenai – 13 • OmkarSawant – 28 • PankajPatil – 29 • PremSawant – 34 • RohitDumbre – 41 • TusharSurana – 53 • VinayakKudva - 55 • VinitPitale - 56
Madras Fertilizers • MFL was incorporated on December 8, 1966 • A joint venture between GOI and AMOCO India incorporated of U.S.A (AMOCO) • MFL had an initial public offering of its shares in May 1997 % • Government of India 59.50 • Naftiran Intertrade Co Ltd 25.77 (Affiliate of NIOC) • Public 14.73 100.00
ROE = 28.45% ROA = -44.72% Asset/equity= -0.636 PM = -11.83 TAT = 3.78 Sales = 1140.06 Sales = 1140.06 TA = 301.54 PAT = --134.85 Fixed Assets = 374.85 Net Current Assets = -73.31 For 2007-2008 x x +
ROE = 33.84% ROA = -30.99% Asset/equity= -1.09 PM = -9.48 TAT = 3.27 PAT = --114.78 Sales = 1210.66 Sales = 1210.66 TA = 370.40 Fixed Assets = 418.44 Net Current Assets = -48.04 For 2006-2007 x x +
ROE = 58.71% ROA = -25.87% Asset/equity= -2.27 PM = -12.15 TAT = 2.13 TA = 509.30 Sales = 1084.22 Sales = 1084.22 PAT = --131.74 Net Current Assets = 45.67 Fixed Assets = 463.63 For 2005-2006 x x +