Download

1 / 39
390 likes | 580 Views
Reliability and Validity of Researcher-Made Surveys. Reliability. “Authors should provide reliability coefficients of the scores for the data they analyze even when the focus of their research is not psychometric.”. Reliability. “Authors should provide reliability coefficients of

E N D
“Authors should provide reliability coefficients of the scores for the data they analyze even when the focus of their research is not psychometric.” Reliability
“Authors should provide reliability coefficients of the scores for the data they analyze even when the focus of their research is not psychometric.” Reliability is the amount of random fluctuation in individual scores. Reliability
“Authors should provide reliability coefficients of the scores for the data they analyze even when the focus of their research is not psychometric.” Reliability is the amount of random fluctuation in individual scores. “In practice, score reliability is a matter of degree, because all scores include some random fluctuation.” Reliability
“It is the reliability of the data in hand in a given study that will drive study results, not the reliability of the scores described in the test manual.” Reliability is the amount of random fluctuation in individual scores. “In practice, score reliability is a matter of degree, because all scores include some random fluctuation.” Reliability
“It is the reliability of the data in hand in a given study that will drive study results, not the reliability of the scores described in the test manual.” “Poor score reliability may compromise … score ‘validity’.” “In practice, score reliability is a matter of degree, because all scores include some random fluctuation.” Reliability
“It is the reliability of the data in hand in a given study that will drive study results, not the reliability of the scores described in the test manual.” “Poor score reliability may compromise … score ‘validity’.” “Poor score reliability may compromise the ability of a study to yield noteworthy effects” Reliability
“Poor score reliability may compromise … score ‘validity’.” “Poor score reliability may compromise the ability of a study to yield noteworthy effects” Reliability
“Scores can’t both measure nothing and measure something.” “Poor score reliability may compromise … score ‘validity’.” “Poor score reliability may compromise the ability of a study to yield noteworthy effects” Reliability
“Scores can’t both measure nothing and measure something.” “Perfectly unreliable scores are perfectly random and cannot yield… significant results.” “Poor score reliability may compromise … score ‘validity’.” “Poor score reliability may compromise the ability of a study to yield noteworthy effects” Reliability
“Scores can’t both measure nothing and measure something.” “Perfectly unreliable scores are perfectly random and cannot yield… significant results.” “Poor score reliability may compromise … score ‘validity’.” “Poor score reliability may compromise the ability of a study to yield noteworthy effects” Reporting Reliability
Reporting Reliability “Reporting reliability coefficients for one’s own data is the exception rather than the norm...Too few reliability estimates for analyzed data are provided in both journals…and doctoral dissertations.”
Reporting Reliability “Reporting reliability coefficients for one’s own data is the exception rather than the norm...Too few reliability estimates for analyzed data are provided in both journals…and doctoral dissertations.”
Reporting Reliability “The most commonly used (reliability) estimate is Cronbach’s (1951) coefficient alpha (a).”
Reporting Reliability “The most commonly used (reliability) estimate is Cronbach’s (1951) coefficient alpha (a).” number of items(sum of item variances) number of items-1test variance 1-
Reporting Reliability “The most commonly used (reliability) estimate is Cronbach’s (1951) coefficient alpha (a).” “Item score covariance plays an important role in both the numerator and the denominator of the estimate.”
Reporting Reliability “The most commonly used (reliability) estimate is Cronbach’s (1951) coefficient alpha (a).” “The intercorrelations of the items are the essential source of this kind of reliability.”
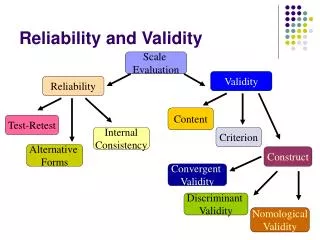
Evidence of Validity • Patterns of Association
Evidence of Validity • Patterns of Association • Comparing Results from Different Versions of the Same Question
Evidence of Validity • Patterns of Association • Comparing Results from Different Versions of the Same Question • Comparing Responses to Data from Other Sources
Evidence of Validity • Patterns of Association • Comparing Results from Different Versions of the Same Question • Comparing Responses to Data from Other Sources • Asking the Same Question Twice and Comparing Results
Evidence of Validity • Patterns of Association • Comparing Results from Different Versions of the Same Question • Comparing Responses to Data from Other Sources • Asking the Same Question Twice and Comparing Results Reliability Reliability
Evidence of Validity • Patterns of Association
Evidence of Validity • Patterns of Association • Scores from different measures believed to measure similar things should correlate. Scores from different measures believed not to measure similar things should not correlate. • Responses to items believed to represent the same dimensions or factors should correlate.
Evidence of Validity • Comparing Responses to Data from Other Sources
Evidence of Validity • Comparing Responses to Data from Other Sources • Compare to records. Compare to physical testing. Compare to population estimates.
Have a reason for every question you ask. Keep questions simple. Keep questions precise. Avoid leading questions. Foresee social desirability. Response options should be mutually exclusive and exhaustive. Provide temporal frame of reference. Use Likert format correctly. Face Validity of Survey Questions
Pilot Testing • Sample size >15 • Discuss questions with respondents to find confusion or ambiguity. • Pretest sample should resemble study sample. • Examine variance among respondents. • Refine answer options. • Time how long it takes.
Produce a Valid and Reliable Attitude or Psychological Scale in 90 Minutes
Produce a Valid and Reliable Attitude or Psychological Scale in 90 Minutes Write a 7 to 10 item scale. 30 minutes Pilot test your items. 15 minutes Use another group. If necessary, revise your scale based on your pilot testing. Administer the revised scale to 10 minutes at least 6 people. Collect data. Enter data on SPSS. 20 minutes Compute coefficient alpha. Revise your scale based on reliability data. Report. 15 minutes
Entering Survey Data on SPSS Item 1 “I like salt.” Strongly Disagree Disagree Neutral Agree Strongly Agree 1 2 3 4 5
Analyzing for Reliability in SPSS 1. Enter survey data. 2. Choose menu options: Analyze Scale Reliability Analysis 3. Choose and move variables to Items box. 4. Click Statistics…Click on: Item Scale Scale if Item Deleted 5. Read output. Identify items which have an “Alpha if Item Deleted” larger than the scale’s Alpha. Remove those items. 6. Re-run analysis with remaining items until satisfied.