Download
1 / 18
180 likes | 201 Views
The Fluidity Indicator is a web-based tool that measures the performance and competitiveness of Canada's supply chains by tracking freight flows and identifying bottlenecks. It provides evidence-based results to governments and stakeholders for better planning and decision-making.

E N D
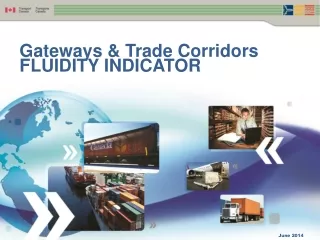
Gateways & Trade Corridors FLUIDITY INDICATOR June 2014
Fluidity Indicator • Tracking the performance of strategic freight routes provides governments and stakeholders impartial evidence-based results on the competitiveness of Canada’s supply chains • The Fluidity indicator is a web-based multi-modal tool that measures in near real-time the performance of individual segments of the supply chains as well as the end-to-end transit time of freight flows • The metric is focusing on bottlenecks and impediments along major trade corridors; with a special attention given to port infrastructure • Transport Canada’s fluidity indicator is an interactive tool in the context of the North American marketplace. Transport Canada - Economic Analysis & Research
Phase 1: IMPORT SUPPLY CHAIN Economic Analysis Directorate Transport Canada - Economic Analysis & Research
CORRIDORS IMPORT: ASIA-PACIFIC Calgary Winnipeg Toronto Montreal Chicago PRINCE RUPERT Calgary Winnipeg Toronto Montreal Chicago • Hong Kong • Shanghai • Qingdao • Tokyo VANCOUVER PHASE 2 CORRIDORS: CONTINENTAL Toronto Chicago MONTREAL • Antwerp • Valencia Economic Analysis Directorate Transport Canada - Economic Analysis & Research
Reliability/VariabilityTotal Transit Time from Shanghai to Toronto via Port Metro Vancouver2010-2013 *Totals may not add due to rounding Transport Canada - Economic Analysis & Research
ALIGNING PERFORMANCE and RESILIENCY Economic Analysis Directorate
Port Utilization Indicators Monthly Intermodal Indicators (5 partner ports) • Average Truck Turnaround Time [Min.] • Berth Utilization [TEU/meter of workable berth] • Average Vessel Turnaround Time [Sec./TEU] • Average Vessel Turnaround Time [Hours] • Average Container Dwell Time [Days] • Dwell Target - % under 72 Hours [%] • Port Productivity [TEU/Gross Ha] • Vessel On-Time Performance [%] • Crane Productivity [Lifts per hour] • Number of Vessel Calls [Number/month] • Average TEU per Vessel Call [Number/month] • Container Throughput [Number/month]
Government’s roleUsing Customs data for better planning Canada Border Security Agency Raw data collection Prior to departure Port Authority (Recipient of “cleaned” data) Transport Canada (Data transformation and distribution) Terminal Operators (Data Consumers) Rail Carriers (Data Consumers) Transport Canada - Economic Analysis & Research
Quantify immediate and residual impacts of disruptions on the rail network such as strikes and/or weather events. 9-day strike: May 23, 2012, Week 20 Residual effects Trend Return to Normal: Week 28 Source: Transport Canada Fluidity database. Please note the data presented is an aggregate of both class 1 rail carriers. Transport Canada - Economic Analysis & Research
Quantify immediate and residual impacts of disruptions on the rail network such as strikes and/or weather events. Source: Transport Canada Fluidity database. Please note the data presented is an aggregate of both class 1 rail carriers. Transport Canada - Economic Analysis & Research
Phase 2: EXPORT SUPPLY CHAIN Economic Analysis Directorate Transport Canada - Economic Analysis & Research
Export Side • Challenging for supply chain measurement • Unit of measurement is a challenge • Identification of commodities • Grains , forest products, Iron ore and coal • Estimating border wait times becomes relevant for our exports • Narrowing the focus: Critical Infrastructure for strategic commodities Transport Canada - Economic Analysis & Research
CORRIDORS GRAINS EXPORT: CANADA-ASIA Western Canada Marine Terminals Alberta Saskatchewan Manitoba Japan Port Metro Vancouver (PMV) Prince Rupert Ocean Transit Times Rail Transit Times Economic Analysis Directorate Transport Canada - Economic Analysis & Research
Geospatial Analysis of Southbound Truck Border Wait Times at Peace Bridge/Fort Erie Crossing • Border wait times are defined as the elapsed time from the last geospatial observation before a trip enters the geofence to first observation when a trip exits the geofence • Trucks with wait times above 90 minutes are assumed to have been sent to secondary inspection and removed from the sample • Trips where the time difference between the last geospatial observation before entering the geofence and the first one inside is greater than 15 minutes are removed from the sample
The fluidity indicator is evidence-based information to assess and analyze the efficiency of our supply chains. The project assists Transport Canada’s work on the identification of constraints in the transportation system. Assist Canadian SMEs through the Canadian Manufacturers and Exporters Association’s Enterprise Project Provide strategic information on the resilience of our supply chains by measuring the recovery rates after major disruptions. It is a horizontal project serving other government departments and initiatives: Department of Foreign Affairs and International Trade and Development Public Safety: Critical Infrastructure Provincial Government – British Columbia Transport Canada - Economic Analysis & Research
Here’s what you see when you login onto the Fluidity Web Portal application. Login procedures are provided by Transport Canada. Fluidity Web Portal
THANK YOUMERCI GRACIAS Economic Analysis Directorate