Download
1 / 20
200 likes | 398 Views
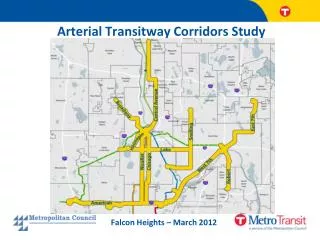
Arterial Transitway Corridors Study. Falcon Heights – March 2012. Arterial Transitway Corridors Study Overview. Corridor Features and Demographics 11 study corridors, 95 route miles Routes: 86,000 daily rides and half of urban local service

E N D
Arterial Transitway Corridors Study Falcon Heights – March2012
Arterial Transitway Corridors Study Overview • Corridor Features and Demographics • 11 study corridors, 95 route miles • Routes: 86,000 daily rides and half of urban local service • Corridors: 450,000 people and 460,000 jobs within ½ mile • Study Structure • Concept/feasibility study led by Metro Transit with SRF Consulting team • Technical and Policy stakeholder partners • Focus on development of “Arterial BRT” concept from Met Council TPP Route Data: 2010 Regional Route Analysis. Population: 2010 Census Blocks; Jobs: 2008 Census LEHD Blck Data
Key Corridor Challenges • Slow transit speeds caused by significant signal and boarding delay • Lack of attractive facilities and identity 1,000 boardings per weekday 4,000 boardings per weekday Based on Route 18 NB observation, American Blvd to 5th/Nicollet
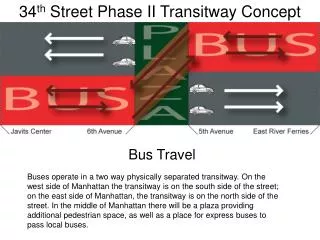
Traditional roadway space allocation leads to slower transit speeds… …but buses carry a large share of people on the road
Arterial Transitway Corridors Study Arterial BRT/Rapid Bus Concept
Rapid Bus/Arterial BRT Service Concept • Local Service • 8 stops per mile • Modest shelters in some locations • Continues at reduced frequency • Arterial BRT/Rapid Bus Service • Primary corridor service • Improved frequency • 2-3 high amenity stations per mile • 98% of existing boardingswithin 1 stop of station locations 30-Minute Local Bus: 10-Minute Service Frequency
Estimated Travel Time Savings from Rapid Bus 58 Minutes Rapid Bus: 17 minutes (29%) faster 41 Minutes 18 Buses: 8 trips/hour each direction 18 Buses: 11 trips/hour each direction Based on Afternoon Peak Period, Route 18 NB, American Blvd to 5th/Nicollet and Concept Plans
Arterial Transitway Corridors Study Study Results and Evaluation
Ridership Results • Significant ridership growth even in no-build scenario • Added service needed to meet growing demand • Even stronger ridership growth in build scenarios • With Rapid Bus, corridor ridership will nearly double Forecasts are total of 11 single-corridor build alternatives (not system forecast of multiple lines). Ridership is for study corridor segments, differs from route-level totals
Estimated Capital and Operating Costs • $3.6 million per year/corridor average operating cost increase • Added service (2030 Service Plans), maintenance of stations and features • Offset by increased revenue Average Corridor: $31 Million • $3-4 million average capital cost per mile • Streetcar ($20 to $40 million/mile) • Light Rail ($60 to $100 million/mile) • Dedicated Busway ($25-$50 million/mile) Contingency $3M Engineering $4M Vehicles $10M Stations and Signals $14M
Evaluation Criteria Draft Results • 5 Project Goals 17 measures, weighted by importance • Proposed improvements appropriate for all corridors in 2030 *West Seventh corridor implemented limited stop service plan in 2004. Unique feature affects relative Goal 1 performance in evaluation
Readiness Factors Readiness Criteria Draft Results • Used to differentiate “first” corridors amongst 11 good corridors • Three readiness factors: • Is the corridor going to be studied in the near future in more detail and for other modes? • Does the corridor’s success depend on (or benefit from) connections to an unfunded transitway investment? • Is additional service planning needed to refine rapid bus in the corridor?
Preliminary Recommendations- Near Term Corridors Ready to Implement in Near Term • Snelling Avenue • West Seventh Street Refine Concept Plans, then Implement: • West Broadway Avenue • Chicago-Portland Avenue Downtown east-west alignment and service plans are key issues for both corridors
Snelling Avenue Rapid Bus Corridor • 9.7 miles, 21 stations, 9 peak buses • $26.8 million capital cost (2011$) • +$3.7M/annual service cost • Strong Performance
Preliminary Recommendations- Additional Corridors • East Seventh Street • Ongoing study of parallel corridors in Gateway and Rush Line studies • Potential extension of West Seventh corridor to St. Paul’s near east side • Further study and stakeholder input needed • Incorporate rapid bus mode in upcoming Alternatives Analysis studies for Nicollet, Central Avenue, Lake Street, Robert Street. • Consider rapid bus on Hennepin Avenue within broader service restructuring for Southwest Transitway implementation. • Grow ridership and continue transitway development connecting to American Boulevard. Plan for future rapid bus implementation.
Next Phase of Study- Share Results and Seek Input • Builds upon previous outreach efforts in 2011 • Individual efforts with 30+communities/organizations • Policy stakeholder discussion February 8, 2012 • Public meetings February-March 2012 • February 28 at Mississippi Market (West 7th), 6-8PM • February 29 at Richfield City Hall, 6-8PM • March 1 at Minneapolis Central Library, 11AM-1PM • March 7 at Hamline-Midway Library, 6-7:30PM • Seeking input on preliminary results
Next Steps: • Complete Study • Stakeholder input project phase (February-March 2012) • Finalize study and prepare final report (March 2012) • Implementation Activities • Select corridor(s) to implement and secure funding • Design and engineering phases • System: branding, architecture, and vehicle design • Corridors: corridor-specific planning and design