Download
1 / 30
300 likes | 454 Views
Observing System Simulation Experiments for COSMIC-II. UCAR COSMIC Team. FORMOSAT-3/COSMIC Follow-on Mission Planning. NSC/NSPO and NOAA are discussing a possible collaboration on the FORMOSAT-3 Follow-On Mission, which is called “COSMIC-II.”

E N D
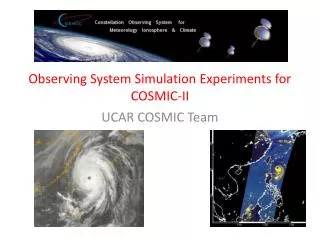
Observing System Simulation Experiments for COSMIC-II UCAR COSMIC Team
FORMOSAT-3/COSMIC Follow-on Mission Planning • NSC/NSPO and NOAA are discussing a possible collaboration on the FORMOSAT-3 Follow-On Mission, which is called “COSMIC-II.” • Preliminary design calls for 12 low-Earth orbiting satellites, each carrying an advanced receiver to track thee navigation systems, including GPS, GALILEO, and GLONASS. • Observing system simulation experiments (OSSE) are useful to assess the potential impacts of the COSMIC-II mission, and to assist in constellation design.
Three Key Questions: • What are the potential impacts of FORMOSAT-3 Follow-on on the prediction of typhoons in the vicinity of Taiwan? • What is the optimal design of the Follow-on Mission? [This needs to be looked at from global, regional weather prediction, climate, and space weather perspectives.] • What are the relative performance of FORMOSAT-3 Follow-on compared with the existing FORMOSAT-3 mission?
Two Possible Configurations • Option A: • 8 satellites placed at 72 degree inclination angle • 4 satellites placed at 24 degree inclination angle • Option B: • 12 satellites placed at 72 degree inclination angle
Distribution of RO soundings in a day G A B FORMOSAT-3/COSMIC COSMIC-IIA COSMIC-IIB Different color shows availability of RO soundings at different hours of the day.
Data Density for FORMOSAT-3, COSMIC-IIA, COSMIC-IIB COSMIC - 6 x 72o COSMIC-IIA - 8 x 72o + 4 x 24o COSMIC-IIB - 12 x 72o COSMIC-IIA Provides a much more even data density around the globe. Enhanced data density over the tropics is important for typhoon prediction.
Selected Case: Typhoon Shanshan (2006) • Min. pressure of 920 hPa on Sep 15, 2006
Nature Run from MM5 with ECMWF Initial condition • Typhoon track recurvature was reproduced • The track is close to the best track • Note that no official intensity observation is available
Forecast Experiment Design • WRF-Var (3D-Var) /WRF with GFS IC and LBC • B.E.: generated from one month forecast of September, 2006 (NMC) • 169 x 157 x 38, ptop = 10 hPa • Assimilation performed on 36-km grid, 1hr update cycle, over two-day period.
Convention Data Are Assimilated As Well Synop SOUND upper air Satellite wind (SATOB) • Upper Air sounding (SOUND) • Observation (SYNOP) • Satellite Cloud track Wind (SATOB) • The horizontal and temporal distribution of these data are consistent with actual observations (location/time, and with realistic errors )
Equator Height pole Percentage of GPS Ref observations Simulated RO Refractivity Data • For GPSRO refractivity, the observation errors vary with height and latitude (Chen and Kuo, 2005). • RO soundings are simulated from the nature run as local value, no ray tracing simulation.
Intensity Forecast C • Intensity Forecast Performance: C+A > C+B > C+G > C C+G C+B C+A Nature
Intensity Forecast Improvement against control (conventional data) forecast Percentage of improvement of intensity forecast • FORMOSAT-3 only shows modest improvement over Control. • COSMIC-IIA shows significant improvements over control. • COSMIC-IIA is superior to COSMIC-IIB Percent Improvement relative to the control: P.I. = (Error of Exp. C minus Error of Exp. X)/Error of Exp. C
Track Forecast Errors • Performance: C+A > C+B > C+G > C C C+G C+B C+A
Track Forecast ErrorsImprovement against control (conventional data) forecast Percentage of improvement of track forecast • FORMOSAT-3 only shows visible improvement over Control. • COSMIC-IIA shows significant improvements over control. • COSMIC-IIA is superior to COSMIC-IIB
6 hour Integrated Precipitation Forecast N C C+G C+A C+B No precipitation system was developed in C, C+G, and C+B, only C+A
6 hour Integrated Precipitation (cont’d) N C C+G C+A C+B • Precipitation in C+A is much closer to that in nature run
6 hour Integrated Precipitation (cont’d) • Late development of precipitation in C, C+G, and C+B, but in wrong locations N C C+G C+A C+B
6 hour Integrated Precipitation (cont’d) • All precipitation is stronger, but C+A still show better location N C C+G C+A C+B
Summary and Conclusions • COSMIC-IIA gives a much more uniform data distribution globally, compared with COSMIC-IIB. • Data density is important for typhoon prediction: • FORMOSAT-3: < 1 over 500 km x 500 km • COSMIC-IIA: > 8 over 500 km x 500 km • COSMIC-IIB: < 4 over 500 km x 500 km
Typhoon Forecast Improvements • We perform two-day data assimilation, followed with three-day forecast for FORMOSAT-3, COSMIC-IIA, and COSMIC-IIB. • Compared with the Control (without RO data) COSMIC-II gives far superior results.
Summary and Conclusions • COSMIC-IIA also gives significantly better precipitation forecasts, in terms of rainfall intensity and distribution. • The Option A design will greatly benefit the prediction of severe weather events over the Taiwan area, including typhoon, Mei-Yu, and mesoscale convective systems.
Data Density for COSMIC and COSMIC-II Options: A, B, C, and D COSMIC - 6 x 72o COSMIC-IIA - 8 x 72o + 4 x 24o COSMIC-IIB - 12 x 72o COSMIC-IIC - 6 x 72o + 6 x 24o COSMIC-IIB - 4 x 72o + 8 x 24o
Intensity Forecast Improvement against control (conventional data) forecast • Intensity: C+D ~ C+C ~ C+A > C+B > C+G > (C) in evident Percentage of improvement of intensity forecast
Track Forecast ErrorsImprovement against control (conventional data) forecast • Track forecast: C+A ~ C+D > C+C > C+B > C+G > (C) in evident Percentage of improvement of track forecast
6 hour Integrated Precipitation N C+G C+A C+B C+C C+D 2A: 8x72 + 4x24, 2B: 12x72 + 0x24, 2C: 6x72 + 6x24, 2D: 4x72 + 8x24
Future Work • Additional cases that affect Taiwan area: • Sinlaku (2008), Jangmi (2008), and other T-PARC and U.S. cases • Mei-Yu convective systems and heavy rainfall events • More realistic simulation of observations: • Ray tracing simulation of RO observations • Take into account available ground stations, and data latency • Use different data assimilation systems: • Global and Regional NCEP GSI system • WRF/DART ensemble data assimilation system • Collaborate with NCEP and ECMWF on global OSSEs and observing system experiments (OSE).
The COSMIC Team Bill Kuo: P.I. on OSSE Study Ted Iwabuchi: WRF-3D-Var and Forecast Bill Schreiner: Mission simulation Zaizhong Ma: Observation simulations Tae-Kwon Wee: Nature run Yong-Run Guo: WRF-Var and Obs. Simulation This work is funded by Dr. Jay Fein at NSF.