Download
1 / 12
120 likes | 244 Views
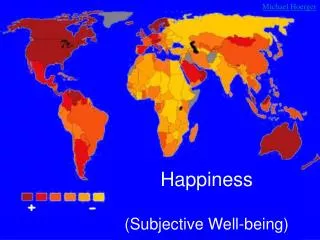
Happiness and Utility: Evidence from New Surveys. Daniel J. Benjamin Ori Heffetz Miles Kimball Alex Rees-Jones. Motivation. Our question: How does revealed preference relate to measures of happiness? In hypothetical scenarios with two options, we measure both choice and predicted SWB.

E N D
Happiness and Utility:Evidence from New Surveys Daniel J. Benjamin OriHeffetz Miles Kimball Alex Rees-Jones
Motivation • Our question: How does revealed preference relate to measures of happiness? • In hypothetical scenarios with two options, we measure both choice and predicted SWB. • Since we relate choice to predicted SWB, we are not focusing on misprediction of SWB. • We find discrepancy between choice and various common survey measures of subjective well-being (SWB). • Discrepancy larger for felt happiness than for measures of overall life happiness / satisfaction. • Discrepancy smaller for individuals with higher measured willingness to pay (WTP) for a better mood.
Survey Designs • ~1500 patients waiting at an endocrinologist’s office in Denver, CO, mostly for ongoing health maintenance (primarily diabetes). • Receptionist handed out anonymous surveys. • Demographics: • Gender: 21% male, 64% female, 15% no response • Mean age: 49 • Race: 72% White/Caucasian, 4% Black/African-American, 4% Hispanic/Latino, 3% other, 17% no response • Median income: ~$100k • Also 222 Cornell undergraduates in WTP for felt happiness surveys.
Choice Scenario: Sleep Question Say you have to decide between two new jobs. The jobs are exactly the same in almost every way, but have different work hours and pay different amounts. Option 1: A job paying $80,000 per year. The hours for this job are reasonable, and you would be able to get about 7.5 hours of sleep on the average work night. Option 2: A job paying $140,000 per year. However, this job requires you to go to work at unusual hours, and you would only be able to sleep around 6 hours on the average work night. Hypothesis: People will recognize that they’d be happier with more sleep, but choose the higher paying job due to responsibility or desire for status.
Do Responses Make Sense? • Both choice and SWB monotonic in income difference. • Smaller deviations for individuals with stronger preference for happiness.
How Well Do SWB Measures Predict Choice? • We estimate (via non-linear least squares) that deviations between choice and SWB for overall life satisfaction / happiness are about 60% the size of deviations for felt happiness. • Of our SWB measures, life satisfaction predicts choice the best. N~850 for each regression
Preference (WTP) for Felt Happiness Suppose you fell into a medium-serious depression. You can still function, but in terms of your mood you feel down most of the time and feel much less cheerful than you normally do. This has been going on for two months with no end in sight. Your doctor tells you, and you confirm by checking things out yourself, that there is only one treatment that will get you back to feeling normal in terms of your mood. This treatment is fast, effective, and has no side effects, but only remains effective as long as you continue it.
Freq.Response 6% Wouldn’t accept even if it were free. 12% Would pay a maximum of 0% of income 7% Would pay a maximum of 1% of income 19% Would pay a maximum of 2% of income 16% Would pay a maximum of 5% of income 13% Would pay a maximum of 10% of income 9% Would pay a maximum of 20% of income 3% Would pay a maximum of 33% of income 7% Would pay a maximum of 50% of income 8% No response 2% Inconsistent responses Mean among consistent responses: 10%.
WTP for Felt Happiness Predicts Current Felt Happiness N = 412
Planned Studies • Between-subjects design • Currently underway. • Nationally-representative sample (N = 1,000) • Current felt happiness, sleep scenario, and WTP for felt happiness on 2009 Cornell National Social Survey (CNSS). • What else matters besides happiness? • Measure other attributes of options, such as health and autonomy. • Estimate utility function with these arguments and compare their importance with happiness.