Download
1 / 27
270 likes | 372 Views
WHOI in s itu observations. New River Inlet. Measurements: Current profilers in channels = 1 min average mean flows ADV on and offshore of shoals = 2 Hz near-bottom flows 8.5-min estimates of wave heights 0.005 < f < 0.300 Hz 1-hr estimates of wave directions

E N D
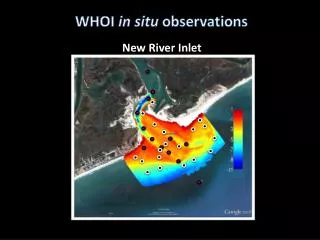
WHOI in situ observations New River Inlet
Measurements: Current profilers in channels = 1 min average mean flows ADV on and offshore of shoals = 2 Hz near-bottom flows 8.5-min estimates of wave heights 0.005 < f < 0.300 Hz 1-hr estimates of wave directions Bottom pressure used for 8.5-min estimates of mean water levels
Measurements: Current profilers in channels = 1 min average mean flows ADV on and offshore of shoals = 2 Hz near-bottom flows 8.5-min estimates of wave heights 0.005 < f < 0.300 Hz 1-hr estimates of wave directions Bottom pressure used for 8.5-min estimates of mean water levels Acoustic surface tracking at 3 locations provides 4 Hz surface fluctuations
Measurements: Current profilers in channels = 1 min average mean flows ADV on and offshore of shoals = 2 Hz near-bottom flows 8.5-min estimates of wave heights 0.005 < f < 0.300 Hz 1-hr estimates of wave directions Bottom pressure used for 8.5-min estimates of mean water levels Acoustic surface tracking at 3 locations provides 4 Hz surface fluctuations Cross-section flow profiles in inlet on May 7, 11, 14, and 21
Wave heights and directions Strong wave dissipation at outer edge of edge shoal
Wave heights and directions Strong wave dissipation at outer edge of edge shoal Flows on outer shoals sometimes tide dominated and sometimes wave dominated
Ebb flows primarily in 2 “jets” & flood flows funnel into inlet Julie & Tom: Simulations suggest waves affect direction of ebb jet
Subtidal flows offshore for SMALL waves & onshore for BIG waves 15 cm/s Anna: Results suggest waves are important to subtidal flows: Balance between pressure gradient, bottom stress, waves
Along-channel flows ~ depth-uniform flood ebb
Along-channel flows ~ depth-uniform Except near Topsail during flood … eddy?? flood Vertical shear ebb
Compare with remotely-sensed estimates of surfacecurrents? Along-inlet distance (m) 1 0.5 Velocity (m/s) Velocity increases towards Topsail (west) 0 offshore -400 -200 0 200 Along-inlet distance (m)
May 21 May 7, 11, 14
Stream-normal (lateral) circulation Little lateral flow
Stream-normal (lateral) circulation Topsail Onslow surface seafloor flood ebb Little lateral flow
Topsail Onslow Stream-normal (lateral) circulation 15 cm/s surface seafloor flood ebb Topsail Onslow surface seafloor flood ebb Little lateral flow
Sub-tidal cross-inlet flows Wind & surface layer: r2 = 0.6 Wind & bottom layer: r2= 0.6 Flow to east Wind velocity (max 10 m/s) Cross-channel flow velocity (m/s) Elevation (mab) Flow to west
Water surface tilts reflect surface flows and convergences Flood (major-axis flows) Sea surface level (cm) Water depth (m) Flood (minor-axis flows) Can the surface elevation be measured remotely?
Wave dissipation on outer shoal • Role of currents (Zippel & Thomson)? • Flows on shoal may be wave or tide driven • Waves shift ebb jet direction • Waves enhance flood flows • Eddy near Topsail? • Two-layer cross-channel flows in inlet • Tidal flows around bend • Winds • Surface elevation reflects flow structure
Into inlet Along-channel flows (m/s) Tropical storm Beryl Out of inlet Tropical storm Alberto Nor’easter Significant wave height (m)
Instrument array plan Current profiler Current meter Pressure gage Current profiler colocated with pressure gage Depth (m relative to msl) Shallow Current meter colocated with pressure gage Bathymetry data provided by Jesse McNinch and the staff of the US Army Corps of Engineers Field Research Facility. Deep 1 km
Research plan: Alongshore dynamics at inlet mouth Flow to northeast Wave forcing Wind Forcing Bed Stress Distance above the bottom (m) Cross- inlet flow velocity (m/s)
Cross-channel subtidal momentum balance Wind & bottom stress: r2 = 0.6 Waves & bottom stress: r2= 0.5 1 0 Forcing (m2s-2 x 10⁻⁴) Wave forcing Wind stress (O(10 m/s)) to southwest -1 01 05 10 15 20 May 2012 Wind data from Jim Thomson
Wave forcing Wind Forcing Bed Stress r2 = 0.5 2 wind + wave forcing Bottom Stress Cdv|U| Cd= 0.006 0 (m2s-2 x 10⁻⁴) to southwest -2 01 05 10 15 20 May 2012
Research plan: Cross-inlet dynamics inside the inlet Introduction: • At idealized headlands during max ebb or flood: • Depth-avg. stream-normal pressure gradient • ≈ depth avg. centrifugal acceleration • [Hench et al., 2002] • This balance develops a ‘dome’ of water across the inlet, restricting lateral mixing to either side. Particle trajectories Hench and Luettich, 2003 Max. flood, Idealized Inlet II Hench et al., 2002 Cross-inlet
Research plan: Cross-inlet dynamics inside the inlet Theory: Stream-normal momentum balance [vertical-avg. subtracted] [Kalkwijk and Booij, 1986; Geyer, 1993] (a) Local acceleration Stream-wise advection Centrifugal acceleration Vertical diffusion Wind stress Bottom stress Depth-averaged stream-normal momentum balance: [Hench and Luettich, 2003] (b) Wind stress Bottom stress Centrifugal acceleration Pressure gradient Cross-inlet