The Scientific Method
The scientific method is a systematic process used by scientists to explore questions and test hypotheses. This guide outlines the essential steps: identifying a problem through observations, conducting research, formulating a testable hypothesis, constructing a detailed procedure, executing the experiment, and analyzing the collected data to draw conclusions. Additionally, it discusses variables, including independent and dependent factors, and emphasizes the importance of using control groups for comparison. Apply these principles to gain reliable insights into scientific inquiries.

The Scientific Method
E N D
Presentation Transcript
TheScientific Method Designing an Experiment
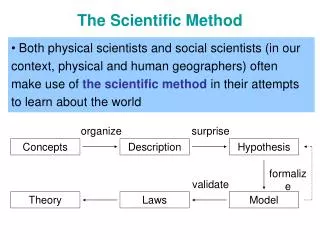
THE SCIENTIFIC METHOD All scientists use certain methods to obtain knowledge. Scientists ask questions, make observations and try to come up with explanations for their questions. This process is called the scientific method.
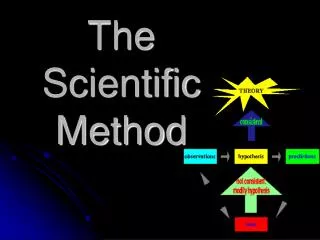
STEPS IN THE SCIENTIFIC METHOD • USE OBSERVATIONS TO IDENTIFY A PROBLEM • DO THE RESEARCH • FORMULATE A HYPOTHESIS • THIS MUST BE TESTABLE • CONSTRUCT A PROCEDURE • STEP BY STEP INSTRUCTIONS • CONDUCT THE EXPERIMENT • COLLECT AND ANALYZE THE DATA • DRAW A CONCLUSION • REPEAT
USE OBSERVATIONS TO IDENTIFY A PROBLEM OBSERVATIONS • CAUSES THE SCIENTIST TO RAISE QUESTIONS • EMPLOYS ONE OR MORE OF THE 5 SENSES TO PERCEIVE OBJECTS OR EVENTS • DIRECT (SEEING A BAT FLAP ITS WINGS) OR INDIRECT (EXAMINING ELECTRICITY) • OBSERVATIONS LEAD TO QUESTIONS
FORMING A HYPOTHESIS • A STATEMENT THAT EXPLAINS THE OBSERVATIONS AND CAN BE TESTED • IF TESTABLE, evidence can be collected that either does or does not support the statement • IF (put independent variable here), THEN (put dependent variable here) statement • If the virus causes a deadly disease, then introducing that virus into healthy tissue will cause it to die.
Independent vs. Dependent • Independent is manipulated variable • This is the variable that you are manipulating in your experiment • Dependent is responding variable • This is the variable that is responding to the independent variable
DRY MIX Dependent Responding Y-axis Manipulated Independent X-axis
PROCEDURE • Step by step directions that are self explanatory • Number your steps • Be specific about equipment, amounts, units, etc… but not wordy • The procedures must be re-producible by others
TEST WITH AN EXPERIMENT • Process of testing a hypothesis by gathering data under controlled conditions Controlled Experiment • You change onefactor or variable and observe its effect on another while keeping all other factors the same or constant Variable: factors that can be changed 2 types: 1. Dependent/Responding Variable: what is being measured ex. Height, growth, amount of oxygen produced, etc. 2. Independent/Manipulated Variable: what you change on purpose ex. Light exposure, food, time, depth, scent, etc.
Experimenting cont… Constant: variables that stay the same through out the experiment ex. Same amount of water in all beakers, same sized beakers, same plants… Control: a sample that is treated like the other experiment groups but the independent variable isn’t applied (what normally takes place) ex. You are testing a new drug. One group received the drug; the other group was a placebo. The group given the placebo is the control group.
COLLECTING AND ANALYZING DATA Forms of Data Collection: 1. Measuring • Quantitative data: data is measured in numbers • Number of people in a group • Measurements of a cube • Duration of an event 2. Sampling • Using a small part to represent an entire population • Must be large and random • Should include as many subjects as possible
Forms of Data Collection cont… • 3. Qualitative Data: • Descriptive and involve characteristics that can not usually be counted • The animal seems healthy and alert • This animal’s fur is less shiny than the other’s • This plant’s leaves seem to be a vibrant green
Forms of Data Collection cont… 3. Organizing Data • Data is useless unless its organized • Data table, graphs, chart, concept map
Analyzing Data • Process of determining whether data you collected is reliable and if it supports your hypothesis or not • Data can be analyzed in several ways • Statistics to determine a relationship between the variables • Compare the data with those obtained in other trials or studies • Determine sources of error
Analyzing Data cont. Data analysis shows general or specific trends or patterns from a graph that you have created from your data chart or table. • General Trend: • From 1955 to 1995, the total amount of ozone decreased from 325 d.u. to 169 d.u in Antarctica. • Specific Trend: • From1964 to 1966, the total amount of ozone increased from 280 d.u to 320 d.u. in Antarctica
Drawing Conclusions • Create a Model • Constructing a representation of an object or process that shows a relationship among the data • Visual, verbal or mathematical • Inferring • Conclusion made on the basis of the facts or data gathered during your experiment • Forming a Theory • May be formed after many related hypothesis have been tested and supported by much experimental data • Broad and comprehensive statement that is thought to be true
Application 1: Plant Project: The Effects of Light on Plant Growth We have 3 pots all growing grass: one is in the dark, one is under a 100 watt light bulb and one is in normal sun light. What is/are the: Control? Constants? Independent Variable? Dependent Variable?
Application 2: • Read the following experiment below. • Identify the control, constant, independent and dependent variable. How do abiotic factors affect different plant species? Materials: presoaked rye and rice seeds, sand, soil, 4 paper cups Procedure: • Use a pencil to punch three holes in the bottom on each cup. Fill 2 cups with equal amounts of sand and 2 cups with the same amount of soil. • Plant 5 rice seeds in one sand cup and 5 rice seeds in one soil cup. Plant 5 rye seeds in the other two cups. Label each cup with the type of seeds and soil it contains. • Place all cups in a warm, sunny location. Each day for 2 weeks, water the cups equally and record your observations of any plant growth.
Application 3: • Analyze the following graph below. In a complete sentence, identify one trend.