Download
1 / 25
250 likes | 376 Views
Pedestrian and Bicyclist Data. Shawn Turner, P.E. Texas Transportation Institute H-GAC Brown Bag Luncheon Houston, TX ~ October 24, 2011. Overview. Why is bicycling & walking data important? What data do we need? National / international activities.

E N D
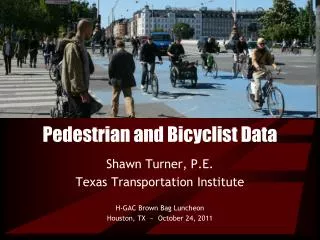
Pedestrian and Bicyclist Data Shawn Turner, P.E. Texas Transportation Institute H-GAC Brown Bag Luncheon Houston, TX ~ October 24, 2011
Overview • Why is bicycling & walking data important? • What data do we need? • National / international activities
Why is bicycling and walkingdata important? • Same reasons as for other modes • Support policy decisions/changes • Plan for cost-effective investments • Design safe facilities and infrastructure • Measure performance and progress toward goals • “What gets measured, gets done” • “If you’re not counted, you don’t count”
Portland Examples Source: Roger Geller, City of Portland
Portland Examples Source: Roger Geller, City of Portland
Portland Examples Source: Roger Geller, City of Portland
What data do we need? • Maintain focus on users and uses of data! • Who needs information (based on your data)? • What decisions are they making? • Avoid collecting data only because: • “that’s what our program plan lists…” • “that’s what my boss said to do…” • “that’s what others are doing…”
Bicycle and Pedestrian Data • Facilities (inventory) • LOS, quality of travel • Usage, trip & user characteristics • Counts, surveys • Crash & safety data • User preferences • Secondary data • Research and evaluation data
Data & Monitoring Challenges • “The forgotten modes” (Tom Larson) • Typically lower priority, fewer resources • Typically small numbers, high variability • Typically on city streets, not major highways • Difficult to automatically count/measure • Scale of facilities
Field Tests of Counters • Texas A&M Campus, College Station • ~2 hours, 470 people (15% in groups) • Brand A, 34% low • Brand B, 11% low • Pfuger Bridge (jogging trail), Austin • In ~2 hours, 967 people (47% in groups) • Brand A, 36% low • Brand B, 26% low • Brand C, 24% low
Austin Regional Monitoring Program State-of-the-practice review Purchased 2 permanent counters and 2 portable counters from Eco Counter http://www.campotexas.org/programs_bicped.php
Opportunities and Advances - 1 • “Grassroots” efforts from within the pedestrian/bicyclist community
Opportunities and Advances - 2 • Map and navigation industry efforts
Opportunities and Advances - 2 • Map and navigation industry efforts
Opportunities and Advances - 2 • Map and navigation industry efforts
Opportunities and Advances - 3 • Pocket-sized, location-aware mobile devices + crowdsourcing and social media
Opportunities and Advances - 3 • Pocket-sized, location-aware mobile devices + crowdsourcing and social media
Opportunities and Advances - 3 Source: Jennifer Dill, Portland State Univ.
National Activities • Alta/ITE National Bicycle and Pedestrian Documentation Project • ABW Benchmarking Report • FHWA Update of Traffic Monitoring Guide • Supporting state-of-practice review • NCHRP 8-78: Demand Forecasting Methods • NCHRP 7-19: Count Collection Methods/Equipment • TRB Ped/Bike Data Subcommittee • And probably lots more!!
Intl. Scan Tour - Monitoring • Bike “barometers”: counters in highly visible locations
Concluding Thoughts • Progress is being made • Equipment • Monitoring programs • Travel surveys • Focus on uses and users • Who? • What decisions? • Capture passion/dedication of advocates • Mobile devices for crowd-sourced data
Questions? shawn-turner@tamu.edu (979) 845-8829 http://tti.tamu.edu