Download
1 / 35
350 likes | 525 Views
Denver Chamber of Commerce. January 16, 2009. Joseph Bateman, VP Public Affairs – Northern Region. Union Pacific System. Seattle. Eastport. Portland. Fast Facts. Duluth. Miles of Track 32,200 in 23 States Employees 49,000 Annual Payroll $3.9 B Customers 25,000 Locomotives 8,700

E N D
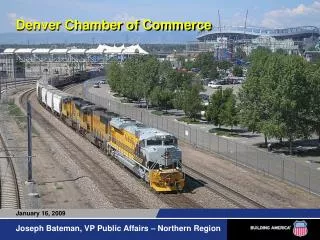
Denver Chamber of Commerce January 16, 2009 Joseph Bateman, VP Public Affairs – Northern Region
Union Pacific System Seattle Eastport Portland Fast Facts Duluth • Miles of Track 32,200 in 23 States • Employees 49,000 • Annual Payroll $3.9 B • Customers 25,000 • Locomotives 8,700 • Freight Cars 106,000 Twin Cities Chicago Omaha SLC Oakland Denver KC St. Louis LA Memphis Dallas Calexico Nogales El Paso New Orleans Houston Eagle Pass Laredo Brownsville
Denver Service Unit Council Bluffs Shawnee Jct. Sioux City S.Morrill Cheyenne Granger Rawlins Fremont North Platte Phippsburg O’Fallons Lincoln Gibbon Jct. Denver Marysville Provo Bond Grand Jct. Topeka Salina Paola Sharon Springs Arco Herington Pueblo Hutchinson Walsenburg Wichita Stratford Dalhart
Denver Service Unit Facts • Employees: 2354 • Miles of Track: 2937 • Main Track: 2448 • Branch Line: 489
Subdivision Train Mix Moffat Tunnel Subdivision • Union Pacific: 16 / 17 Trains per day • Amtrak: 2 Trains per day • Ski Train: 2 Trains, 4 days a week • BNSF: 4 Trains per day
Subdivision Train Mix Colorado Springs Subdivision • Union Pacific: 6 / 7 Trains per day • BNSF: 40 Trains per day
Subdivision Train Mix Greeley Subdivision • Union Pacific: 16 / 17 Trains per day Limon Subdivision • Union Pacific: 14/16 Trains per day
Freight Railroads in Colorado 2006 • Number of Freight Railroads 14 • Miles Operated* 2,645 • Total Carloads Carried 2,873,787 • # of Freight RR Employees 3,042 • Average per Freight RR Employee • Wages $69,900 • Benefits $27,100 Total Compensation $97,000 Total Wages of Freight Employees $ 212 M RR Retirement Beneficiaries 7,349 RR Retirement Benefits Paid $112 M • * excludes trackage rights
Tons Originated 2006 Tons Terminated 2006 % % Millions Millions Coal 24.3 73% Coal 16.1 49% Food Products 2.0 6 Nonmet. Minerals 2.9 9 Petroleum Products 1.3 4 Glass & Stone Prod. 2.3 7 Nonmetallic Minerals 1.4 4 Lumber & Wood 1.8 6 Glass & Stone Prod. 1.1 3 Chemicals 1.3 4 All Other 3.2 10 All Other 8.4 26 Total 33.5 100% Total 33.1 • 100% Freight Railroads in Colorado, cont. Millions of Rail Tons Carried
UP Colorado Capital Spending 20032004200520062007 $64 $108 $65 $53 $64 Total 5 years $354M or Average $71M/year
Freight Railroads Are the Transportation Backbone of America • Connect businesses and consumers across the country and overseas • Most efficient and cost-effective in the world • ~$25 billion in wages and payments to retirees each year • Billions of dollars in local purchases and taxes
The Fundamentals of Railroad Economics Cannot be Ignored Railroads are networks: what happens in one place affects many others. Can’t be easily picked up and moved. “Density is the god of transportation.” Huge differences in customer demands and options.
U.S. Freight Railroads Have Certain General Characteristics Vast majority privately-owned Typically, same company owns the track and operates trains over it • No forced access • Low government funding Freight & passenger are separate
America’s Freight Railroads: Freight Transportation Leaders • (ton-miles) • Railroads • Trucks • Water • Pipeline • Pipeline does not include natural gas. Source: Bureau of Transportation Statistics
U.S. Railroad Performance: 1964-2007 • (Index 1981 = 100) • Productivity • Volume • Staggers Act Passed Oct. 1980 • Revenue • Price • Source: AAR
Armour Yellow Outside -- Green Inside • Rail Transportation Is Three Times More Fuel Efficient Than Trucks. • UP Can Haul One Ton 790 Miles on One Gallon of Diesel Fuel. • One Intermodal Train Takes up to 280 Trucks off the Highway, the equivalent of 1,100 automobiles. • One slot for a passenger train consumes 2 freight train slots. • 2 freight train slots therefore equal 560 trucks or the equivalent of 2,220 autos. UP “Green Goat” Hybrid Locomotive
Double the Freight on Same Amount of Fuel! • (Index 1980=100) • Volume = revenue ton-miles. Source: AAR
Ways Railroads Conserve Fuel • New locomotives “Gensets” Hybrids • Technology Monitoring systems Idle reduction Trip planning software Training Component design
Freight Rail is Cleaner • 1:13 • 1:22 • 1:7 • 1:4 • *Volatile organic compounds Source: Univ. of Iowa Public Policy Center for the U.S. DOT
Freight RRs Account for <1% of Greenhouse Gas Emissions U.S. Greenhouse Gas Emissions by Source: 2006 • Trucking5.7% • Non-transportation • 72.4% • Freight RRs - 0.7% • Other freight transport • 1.2% • Passenger transport* • 20.0% • *On-road vehicles, aircraft, recreational boats, passenger rail • Source: EPA
Steady Rise in Rail Carloads • (millions of carloads originated) • Data are for Class I railroads. Includes WRPI from 1991-1995. Source: AAR
One Result of Traffic Growth: Tight Capacity on Parts of the Rail Network • Millions of Class I Ton-Miles Per Mile of Road Owned • Source: AAR
What Are Railroads Doing to Increase Capacity? Aggressive hiring • Massive equipment and infrastructure investment New operating plans Cooperative alliances Working with customers Technology
Record Capital Spending • Class I RR Capital Spending • ($ Billions) • $9.2 • Source: AAR
1. • Texas • $7.57 • 2. • $5.69 • Florida • 3. • $4.19 • California • $4.17 • Union Pacific • $3.89 • BNSF • 4. • $3.59 • New York • 5. • $3.30 • Pennsylvania • 6. • $3.30 • Illinois • $2.62 • CSX • 7. • $2.61 • Michigan • 8. • $2.48 • North Carolina • 9. • $2.14 • Ohio • $2.12 • Norfolk Southern • 10. • $1.88 • Georgia Railroads Spend More Than Most State Highway Agencies! • Class I Railroad Spending* on Way & Structures • vs. • State Highway Agency Spending* - 2006 • ($ billions) • *Data include capital outlays and maintenance expenses. • Sources: FHWA Highway Statistics Table SF-12, AAR
National Rail Freight Infrastructure Capacity and Investment Study • Prepared for the National Surface Transportation Policy and Revenue Study Commission. • First effort of its kind involving the freight railroads. • Objective: estimate cost to expand rail infrastructure to handle traffic forecast by DOT for 2035
0-50 • 50-100 • 100-2,500 % Growth in Trains Per Day From 2005 to 2035 by Primary Rail Corridor
Below capacity • Near capacity • At capacity • Above capacity Future Corridor Volumes Compared to Current Corridor Capacity • 2035 without improvements
Support Passenger Rail - But Not at the Expense of Freight Rail Passenger service should complement, not conflict with, freight service. Adequate liability protection. Fully compensate freight railroads for passenger use of their property. No forced commuter rail access to freight-owned property. • Freight railroads should not be expected to subsidize passenger service.
True High-Speed Passenger Rail Can’t Work on Freight Tracks • Safety • Operating differentials Capacity and efficiency • Engineering requirements
Points to Remember Regarding High-Speed Passenger Rail If we’re going to do it, do it right. Fast, dependable service necessary to compete with air and highway. Piggy-backing on freight railroads will give yield a third-rate passenger rail system. Goals of reducing pollution and highway congestion can be realized if we ensure that passenger trains don’t interfere with freight service.
Denver Chamber of Commerce January 16, 2009 Joseph Bateman, VP Public Affairs – Northern Region