Download
1 / 27
270 likes | 425 Views
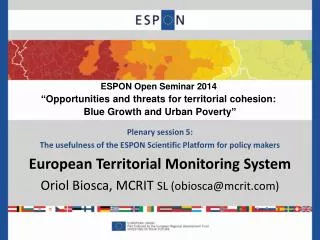
Plenary session 5: The usefulness of the ESPON Scientific Platform for policy makers European Territorial Monitoring System Oriol Biosca, MCRIT SL (obiosca@mcrit.com). ESPON Open Seminar 2014 “ Opportunities and threats for territorial cohesion: Blue Growth and Urban Poverty ”.

E N D
Plenary session 5: The usefulness of the ESPON Scientific Platform for policy makers European Territorial Monitoring System Oriol Biosca, MCRIT SL (obiosca@mcrit.com) ESPON Open Seminar 2014 “Opportunities and threats for territorial cohesion: Blue Growth and Urban Poverty”
Aim of the European Territorial Monitoring System • To provide “a continuous monitoring of territorial trends and structures, • so to provide policy relevant information to target groups, • for specific type of territories, metropolitan regions, cities and towns, • in relation to the policy aims and priorities of the Europe 2020 Strategy, EU Cohesion Policy and the TA 2020”.
Partners behind the development of the ETMS • MCRIT, Barcelona UAB. Autonomous University of Barcelona UNIGE. University of Geneva Nordregio, Stockholm GISAT, Prague
Main Products: State of Territory & Facts&Figures periodic reports
Main Service: Interactive data analysis tool by territorial specificities
Main Service: Interactive data analysis tool by territorial specificities
Analysis of current policy debates / issues Economy ETMS Indicators Environment • Around 30 indicators • 5 Area Topics • 2000-2012 time series • Including several EU2020 headline indictors Human capital Social Inclusion Accessibility
Analysis of current policy debates / issues ETMS Indicators ETMS allows mapping indicators filtering by different territorial typologies and structures Maps by types of territory Regional typologies (based on NUTS) Territories with specificities Cities Transnational Cooperation Areas
1. Maps based on NUTS data by regional typologies DG Regio Urban Rural typology: urban – intermediate - rural eg Birth rate (children per 1000 inhabitants) for “Rural Regions”
1. Maps based on NUTS data by regional typologies ESF/ERDF 2014-2020: less developed – transition - more developed Eg. Birth rate (children per 1000 inhabitants) for “Less Developed Regions”
1. Maps based on NUTS data by regional typologies EUROSTAT Metropolitan Typology: Capitals - 2nTier – Small Metros Eg Birth rate (children per 1000 inhabitants) for “Capital Cities”
2. Maps for territories with regional specificities (based on LAU) Mountain ranges as defined in ESPON GEOSPECS e.g. Old age dependency ratio (% population > 64 / % population 16-64)
2. Maps for territories with regional specificities (based on LAU) Islands as defined in ESPON GEOSPECS e.g. Old age dependency ratio (% population > 64 / % population 16-64)
3. Maps based on data at City level Large Urban Zones - LUZ e.g. Employment rate (%employed / population 20-64)
4. Maps by Areas of Regional Cooperation INTERREG Cooperation Areas 2006 2012 Eg Migrations (persons per year) in the Mediterranean and the Northern Peripheries
Analysis of current policy debates / issues ETMS Indicators Maps by types of territory Analyses Regional typologies (based on NUTS) Territories with specificities Cities Transnational Cooperation Areas
1. Benchmark a region against others in the same typology e.g. Old age dependency ratio for Mountain Massifs in Europe Two examples of different territorial resolution in ET
1. Benchmark a region against others in the same typology e.g. Old age dependency ratio for Mountain Massifs in Europe Two examples of different territorial resolution in ET
2. Compare selected regions for a given indicator e.g. discontinuities on Birth Rate in the Frenco-Italian border
2. Compare selected regions for a given indicator e.g. discontinuities on Birth Rate in the Frenco-Italian border
2. Compare selected regions for a given indicator e.g. discontinuities on Birth Rate in the Franco-Italian border French regions Italian regions
3. To compare 2 indicators on a scatter chart e.g. Birth Rate vs Old-Age dependency ratio
3. To compare 2 indicators on a scatter chart e.g. Birth Rate vs ODR in the Frenco-Italian border French regions Italian regions
4. Time series of indicators by territorial typologies e.g. GDP per capita in different urban/rural areas in Europe
Plenary session 5: The usefulness of the ESPON Scientific Platform for policy makers Thank you Oriol Biosca, MCRIT SL (obiosca@mcrit.com) ESPON Open Seminar 2014 “Opportunities and threats for territorial cohesion: Blue Growth and Urban Poverty”