Download
1 / 23
230 likes | 263 Views
A Review of Monthly/ Seasonal Climate Variability for 2005-2006: The ENSO Cycle. Vernon E. Kousky NOAA/Climate Prediction Center October 23, 2006. Outline. Recent Evolution & Current Conditions Historical Perspective Pacific SST Outlook Summary.

E N D
A Review of Monthly/ Seasonal Climate Variability for 2005-2006: The ENSO Cycle Vernon E. Kousky NOAA/Climate Prediction Center October 23, 2006
Outline • Recent Evolution & Current Conditions • Historical Perspective • Pacific SST Outlook • Summary
Evolution of Equatorial Pacific SST Departures During late 2005-early 2006 SST anomalies decreased and below-average temperatures developed throughout most of the central and eastern equatorial Pacific. In February 2006 positive SST anomalies developed in the extreme eastern equatorial Pacific, similar to what occurred during the La Niñayears1999, 2000 and 2001. Since May 2006, positive SST anomalies have increased across the equatorial Pacific between 160E and the South American coast. Time Longitude
Tropical OLR and winds: 22 Feb-19 Mar 2006 Negative OLR anomalies (enhanced convection and precipitation, blue shading) were observed over northern Indonesia, northern Australia and the Philippines, and in the vicinity of Hawaii. Positive OLR anomalies (suppressed convection and precipitation, orange shading) were observed over the central equatorial Pacific and over the NH eastern tropical Pacific. C Low-level easterly wind anomalies were observed over the central and western equatorial Pacific between 155E and 140W. Upper-level westerly wind anomalies were observed over the equatorial Pacific between 150E and 115W. Cyclonic circulation anomalies (indicated by C in the figure) were observed north and south of the equator over the central tropical Pacific. C C C The patterns of anomalous OLR and wind were consistent with La Niña conditions.
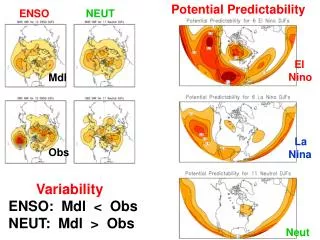
Niño Indices: Evolution The latest weekly SST anomalies are positive (between +0.8C and +1.2C) in all of the Niño regions.
EQ. Pacific Upper-Ocean (0-300 m) Heat Content & SST Anomalies Decreasing upper-ocean heat content was observed during July 2005 through January 2006. Beginning in early February upper ocean heat content increased and, since early April heat content anomalies have been positive. Decreasing SST anomalies were observed during late 2005 through January 2006. Beginning in late March anomalies increased and, since late May positive anomalies have been observed.
Upper-Ocean Conditionsin the Eq. Pacific • The basin-wide equatorial upper ocean (0-300 m) heat content is greatest prior to and during the early stages of a warm (El Niño) episode (compare top 2 panels) and least prior to and during the early stages of a cold (La Niña) episode. • The slope of the oceanic thermocline is least (greatest) during warm (cold) episodes. • The most recent values of the upper-ocean heat anomalies (positive) and the thermocline slope index (near zero) indicate the early stages of El Niño. Cold Episodes Warm Episodes Themocline slope index is the difference in the anomalous depth of the 20C isotherm between the western Pacific (160E-150W) and the eastern Pacific (90-140W).
Recent 4-Week Average SST Anomalies in the Tropical Pacific • Equatorial ocean surface temperatures were greater than 0.5ºC above average across the equatorial Pacific between 160ºE and the South American coast. Departures exceeded +1ºC between 165ºE and 145ºW, and between 85ºW and 125ºW. • 17 September-14 October 2006
Global SST Departures (Deg C): 17 September-14 October 2006 The equatorial SSTs are above average everywhere except in the vicinity of Indonesia. The subtropical Atlantic basin (5-25N) has been warmer than average for more than a year.Positive anomalies dominate the high latitudes in the North Atlantic Ocean and west-central North Pacific Ocean.
Tropical OLR and winds: last 30 days Negative OLR anomalies (enhanced convection and precipitation, blue shading) were observed between the date line and Papua/ New Guinea, and over the southwest North Pacific. Positive OLR anomalies (suppressed convection and precipitation, orange/red shading) were observed over western Indonesia, portions of Malaysia and the eastern Indian Ocean. Westerly anomalies (weaker-than-average easterly winds) were observed near the equator between Papua New Guinea and the Date Line (180W). Equatorial low-level winds were near average east of the Date Line. Easterly upper-level (200hPa) equatorial zonal wind anomalies were observed over Indonesia and the western Pacific west of the Date Line. Westerly anomalies were observed over the extreme eastern equatorial Pacific. The pattern of anomalous OLR over the equatorial Pacific during the last 30 days reflects the early stages of El Niño.
Heat Content Evolutionin the Eq. Pacific • The upper-ocean heat content gradually decreased in the eastern and central equatorial Pacific and increased in the extreme western equatorial Pacific during mid-2005. as a precursor to weak La Niña conditions that developed in late 2005. • During March-April 2006 the upper-ocean heat content increased as La Niña conditions weakened and ENSO-neutral conditions became established. • The basin-wide warmth, as observed in recent months, is usually observed prior to and in the early stages of El Niño. • Throughout this period variability in heat content has been present due to weak Kelvin wave activity. Time The downwelling (upwelling) phase of Kelvin waves is indicated by the dashed (dotted) lines. Downwelling (upwelling) produces an increase (decrease) in upper-ocean heat content. Longitude
Subsurface Conditionsin the Eq. Pacific • During August-September 2006 positive subsurface temperature anomalies were observed throughout the equatorial Pacific. A pattern of basin-wide positive subsurface temperature departures is usually observed prior to and in the early stages of El Niño. • The most recent analysis shows positive anomalies, between the surface and 200 m depth, across most of the equatorial Pacific. Time Most recent pentad analysis Longitude
Low-level (850-hPa) Zonal (east-west) Wind Anomalies (m s-1) Weaker-than-average easterlies (orange/red shading). Stronger-than-average easterlies (blue shading). Time Low-level easterly winds have averaged weaker than normal over the western equatorial Pacific between 130E and 170E. Since July, anomalous westerly winds have also dominated the east-central equatorial Pacific. Longitude
200-hPa Velocity Potential Anomalies (5N-5S) Positive anomalies (brown shading) indicate unfavorable conditions for precipitation. Negative anomalies (green shading) indicate favorable conditions for precipitation. Time In early March the MJO activity weakened and became incoherent. Weak MJO activity was evident during May- early August 2006. Since early September MJO activity has intensified. Longitude
Outgoing Longwave Radiation (OLR) Anomalies Drier-than-average conditions (orange/red shading) Wetter-than-average conditions (blue shading) Time Since early August, suppressed convection has been persistent over the eastern Indian Ocean and Indonesia. Recently, enhanced convection has developed over the western tropical Pacific. Longitude
ONI: Evolution since 1950 The most recent ONI value (July-September 2006) is 0.4C. El Niño neutral La Niña
Niño 3.4 evolution – Comparison for El Niño episodes Recent Niño 3.4 values, derived from ERSST.v2, lie in the lower half of the distribution of historical El Niño episodes since 1950. Most recent Niño 3.4 values (heavy black line) compared to values for 14 historical El Niño episodes. On the time axis year 0001 is the first year of a warm episode.
Niño 3 evolution – Comparison for El Niño episodes Recent Niño 3 values, derived from ERSST.v2, lie in the middle of the distribution of historical El Niño episodes since 1950. Most recent Niño 3 values (heavy black line) compared to values for 14 historical El Niño episodes. On the time axis year 0001 is the first year of a warm episode.
Niño 4 evolution – Comparison for El Niño episodes Recent Niño 4 values, derived from ERSST.v2, lie in the upper half of the distribution of historical El Niño episodes since 1950. Most recent Niño 4 values (heavy black line) compared to values for 14 historical El Niño episodes. On the time axis year 0001 is the first year of a warm episode.
Niño 1+2 evolution – Comparison for El Niño episodes Recent Niño 1+2 values, derived from ERSST.v2, lie in the upper half of the distribution of historical El Niño episodes since 1950. Most recent Niño 1+2 values (heavy black line) compared to values for 14 historical El Niño episodes. On the time axis year 0001 is the first year of a warm episode.
Pacific Niño 3.4 SST Outlook • Most statistical and coupled model forecasts indicate weak or moderate El Niñoconditions through April-June 2007. Figure provided by the International Research Institute (IRI) for Climate and Society (updated 18 October 2006).
SST Outlook: NCEP CFS 19 October 2006 The CFS ensemble mean (blue line) indicates El Niño conditions through NH spring 2007.
Summary • The recent atmospheric circulation and precipitation patterns indicate weak El Niño conditions in the tropical Pacific Ocean. • SST anomalies are between +0.8C and +1.2C in all of the Niño regions. • Based on recent trends and a majority of the statistical and coupled model forecasts El Niño conditions should intensify during the next 3-4 months and will likely continue through April-June 2007.