Download
1 / 32
320 likes | 343 Views
This Master's thesis explores a method to reduce test application time and test power dissipation in scan-based built-in self-test (Scan-BIST) circuits. It focuses on utilizing the transition density of test vectors to generate effective tests that are power-constrained and reduce test application time. The thesis presents background information, problem statement, contributions, results, conclusion, and future work.

E N D
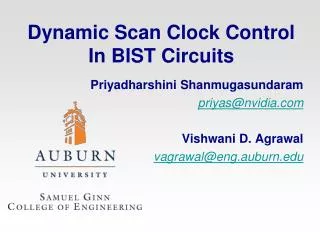
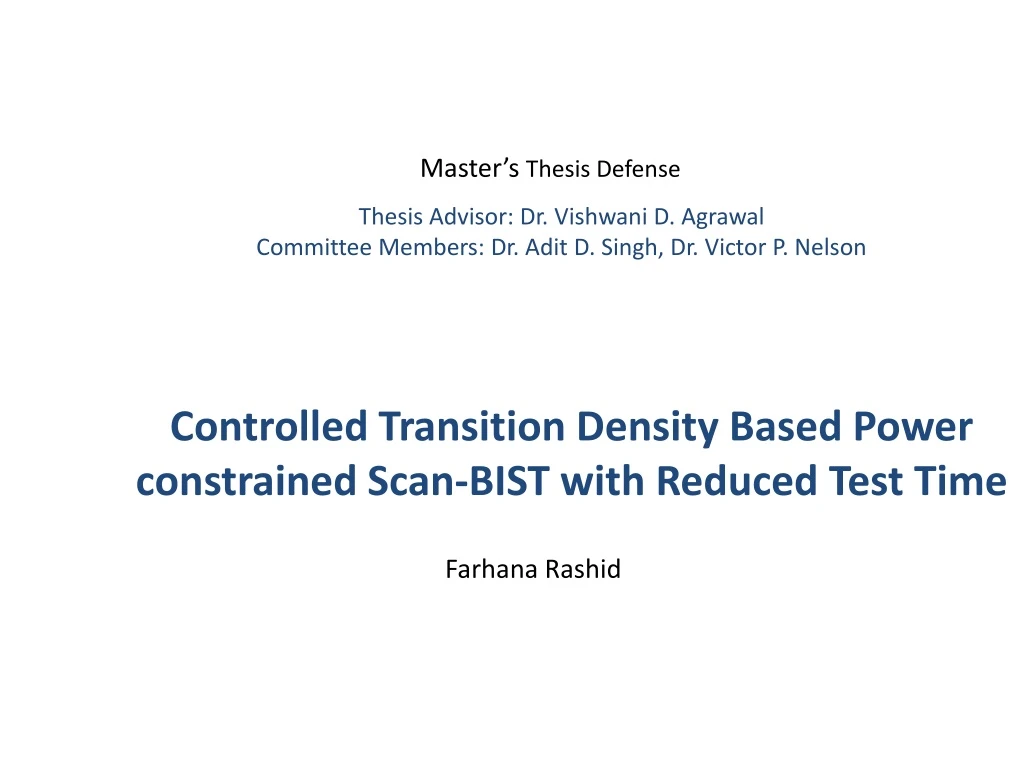
Master’s Thesis Defense Thesis Advisor: Dr. Vishwani D. AgrawalCommittee Members: Dr. Adit D. Singh, Dr. Victor P. Nelson Controlled Transition Density Based Power constrained Scan-BIST with Reduced Test Time Farhana Rashid
Outline • Motivation • Problem Statement • Background • Contributions • Results • Conclusion & Future work • References
Motivation • Test application time and test power dissipation are two major areas of concern for test engineers • High power dissipation during test mode compared to circuit’s normal mode operation leads to various problems like hot spots, performance degradation , shorten battery life , even from chip malfunction to chip failure • Cost of chip is directly related to test application time for externally tested circuits, but longer test time is undesirable in Self –Tested circuits as well. • Many techniques have been proposed to tackle these two issues separately • For reducing power test clock is slowed down or low transitions in test vectors were aimed for which in turn elongated test time • Test clock can not be made faster because it raises the power consumption during the test procedure A method that contributes to benefit both the cases ,test time and test power is the motivation behind our work.
Problem Statement • Use transition density of the vectors to produce effective test that will • Be power constrained • Reduce test application time • Achieve sufficient fault coverage
Background • Built-In Self Test • Circuit tests itself • Test per scan • BIST applies one test per vector • Scan in bit by bit a vector, apply one clock then scan out response bit by bit BIST Implementation
Background • Scan design • Chain flip-flops to form shift register during test • Test vectors scanned in and responses scanned out through mentioned shift register • Flip-flops function as points of observability and controllability • Scan-BIST • Scan technique implemented in BIST Scan out Scan-in
Background • Transition density T, of a signal is defined as the number of transitions per unit time, i.e. T=N(t)/t • transition density of a clock signal is 2 according as there are two transitions, one rising and the other falling in a unit time. • In two bit sequences, even if the number of 1s and 0s are same, the transition density in each case can be different • 0011001100 has a transition density 4/10=0.4 • 1010010100 has a transition density 7/10= 0.7 • Even though the number of 1s and 0s are same in both the bit sequences • The number of 1s (0s) in a bit sequence accounts for the weight of the bit sequence. • Both the sequences have equal weight 4/10=0.4
techniques based on transition density • Low power test generation • low transition/toggles patterns generators • Aims to generate high correlation between successive vectors=> test power follows normal mode power • Control switching activity during test • Results in longer test sessions to reach sufficient fault coverage • Reduce scan –in time • Strong correlation between number of transitions in scan cells and test power dissipation[1] • Low activity in scan chain => scan frequency can be increased without exceeding power budget[2]
Best case transition density selection based on fault coverage • Weighted random patterns • Generates effective test with shorter length • For every circuit there exist one weight for random patterns that detects most faults with fewest number of vectors • Weights are defined as probability of a bit being 1 (or 0) • This is defined as best case weight • In circuit s1269 0.6 weight (probability of 1s =0.6) is results in best test set generation Fault profiles of s1269
Best case transition density selection based on fault coverage • Best case transition density • Analogously effective test set can be generated by generating vectors based on transition density • There will exist a transition density that will detect more faults with fewer vectors • This is defined as best case transition density • In circuit s1269 0.5 transition density results in best test set generation Fault profiles of s1269
Estimation of best transition density from best case weighted random pattern Fault simulation done with AUSIM for 10000 vectors for weight and transition density of 0.1-0.95 with 0.05 intervals • If best case weight for a circuit is p1 • p1= probability of bit being 1 • P0= probability of bit being 0 • Best case transition density 2*p1*p0 Best case transition density for ISCAS89 circuits
Comparison between WRP & TD patterns • In some of cases TD patterns are as good as WRP in detecting faults • fault coverage reached by TD is very high • 95%-99% • However 100% fault coverage was not achievable WRP=weighted random pattern TD=transition density patterns Number of vectors needed to reach 95% faults
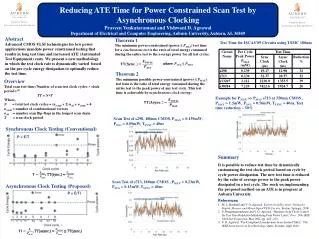
Adapting scan clock with transition density of test vectors • Peak power is the maximum energy consumed in any clock cycle divided by clock period • Power in any cycle is below peak power =>Peak power never crosses power budget
Speedup in scan in time for circuits with multiple chains • Inactivity monitor monitors each scan chain and adds up cumulative non-transitions entered scan chain • Frequency divider block provides frequency • MUX selects required frequency when signaled to step up by inactivity monitor Adaptive scan clock implementation in scan BIST with multiple chains
Assuming capture activity α=1 • Number of flip –flops in CUT=N • Number of scan chains= m • Flip flops per scan chain=N/m • Scan always starts at lowest frequency • Step up frequency if cumulative non –transitions in scan chain N/v
Experimental results • The maximum reduction in scan time ca be reached as compared to Fixed clock scan method is 50% • For pseudorandom patterns from the BIST TPG time reduction will be around 25% • Number of vectors chosen based on fault simulation done earlier Scan in time reduction in ISCAS89 circuits
The power budget is never crossed. • For clarity only 100 cycles are plotted • The green bar is the power budget line => maximum peak power consumed in Fixed scan clock scheme • For simulation • Time simulated in Modelsim • Synthesized in Leonardo Spectrum • SPICE netlist written by Design Architect • Simulated in NanoSim for peak power report Per clock peak power consumption with and without adaptive scheme for s1196
Modified TPG for Controlling Transition density • We propose a modified TPG • A LFSR => a 28 bit LFSR is used with external feedback • A combinational part to generate weights (probability of 1s and 0s) • A FSM to select from the weights • A Toggle flip –flop to generate transitions according to the weight selected. • FSM keeps track of numbers of patterns applied through the BIST controller • Simple AND gates and inverters are used for weights. • Output s of non adjacent cells are taken to construct the weights Modified test patterns to control transition density
For multiple chains • The weights are duplicated. • All the single wires are changed to M bit bus • M flip-flops are added • A negligible area overhead Modified test patterns to control transition density-multiple chains
Fault coverage by modified TPG • 10000 vectors for each transition density were generated • Faults simulation were done in AUSIM using HPCC • 0.25 TD gives the best test set with shortest length. • The speed up will be effective in this case • Total test time will reduce if 0.25 transition density used in place of 0.5 • Adaptive scheme can also speed up • Best case wrp=0.875 • Best case td= 2*0.875*0.125 • =0.21877 performance of vectors based on transition density and weighted random pattern s1512
For circuit s510 • 10000 vectors for each transition density were generated • Faults simulation were done in AUSIM using HPCC • 0.4375 TD gives the best test set with shortest length. • The speed up will not be effective in this case • Total test time will reduce will not reduce • It is to be noted • Best case wrp=0.4375 • Best case td= 2*0.4375*0.125 • =0.4921 performance of vectors based on transition density and weighted random pattern s510
Fault profiles for transition densities 0.1 -0.5 shows • 70% faults can be detected with any TD with almost same number of vectors • The higher fault coverage the more efficient is the best case transition density • For circuits with best case 0.4-0.5 • A controlled transition density mixing gives same coverage with same number of vectors
A greedy approach • Problem solving heuristic • At each stage find a locally optimal solution • Finding locally optimal solution at every step may generate globally optimal solution • For many problems it may fail to produce globally optimum Solutution • Five pillars • A candidate set, from which a solution is created • A selection function, which chooses the best candidate to be added to the solution • A feasibility function, that is used to determine if a candidate can be used to contribute to a solution • An objective function, which assigns a value to a solution, or a partial solution, and • A solution function, which will indicate when we have discovered a complete solution
Candidate set • n Number of partial fault coverage • Selection function • At each paritalcoverage,select TD with min(vector* time reduction) • Feasibility function • Total number of vectors < best case transition density vectors • Objective function • Overall reduction in scan in time • Solution function • Target fault coverage reached
A matlab program was written to implement the algorithm • Fault profile generated from AUSIM was used as the candidate to select from
The resultant vector set with mixed transition density is as good as the best case transition density • Test application time can be reduced if lower frequency are given Fault profiles comparison between best case transition density and mixed transition density
The same hardware can be used • FSM is programmed • Vary transition densities as decided by the algoritm
Greedy algorithm was able to choose the transition densities without sacrificing fault coverage
Conclusion • Transition density can be effectively chosen to • Generate test of shorter length • Combining best case transition density and adaptive scan clock scheme test application time can be reduced • Best case transition density if lies below 0.4 we can speed up test better. • For transition densities 0.4 -0.5 greedy method can be used to choose the mixing of transition density effectively • The experimental results show a further 10-13% decrese in test application time • In the future, more sophisticated methods for obtaining the controlled transition density mixing in the vector set by using linear programming should be examined to balance the test time and test power more efficiently.